|
For the beginning part of today, we talked about what each one of us hoped to get out of this program. I really find it cool that we get to use the coding skills we learned in computer science classes and actually apply it to real world applications, potentially seeing our work help the lives of others or help the town. After that, we watched a TED Talk about ignorance and how not to be ignorant about the world, given by Hans Rosling and his son Ola Rosling. The talk was really interesting, as we humans tend to be ignorant because of personal biases (the places where we grew up, limiting our perspective because they are small), outdated data and world views taught by teachers, and news biases. Surprisingly, one of the largest things that make us human, our intuition, guesses based upon these factors and most of the time comes to negative conclusions that the world is becoming worse, when in actuality the world is progressing and becoming better. In order to not be ignorant, we need to go against our intuition and guess that things will naturally get better with time. 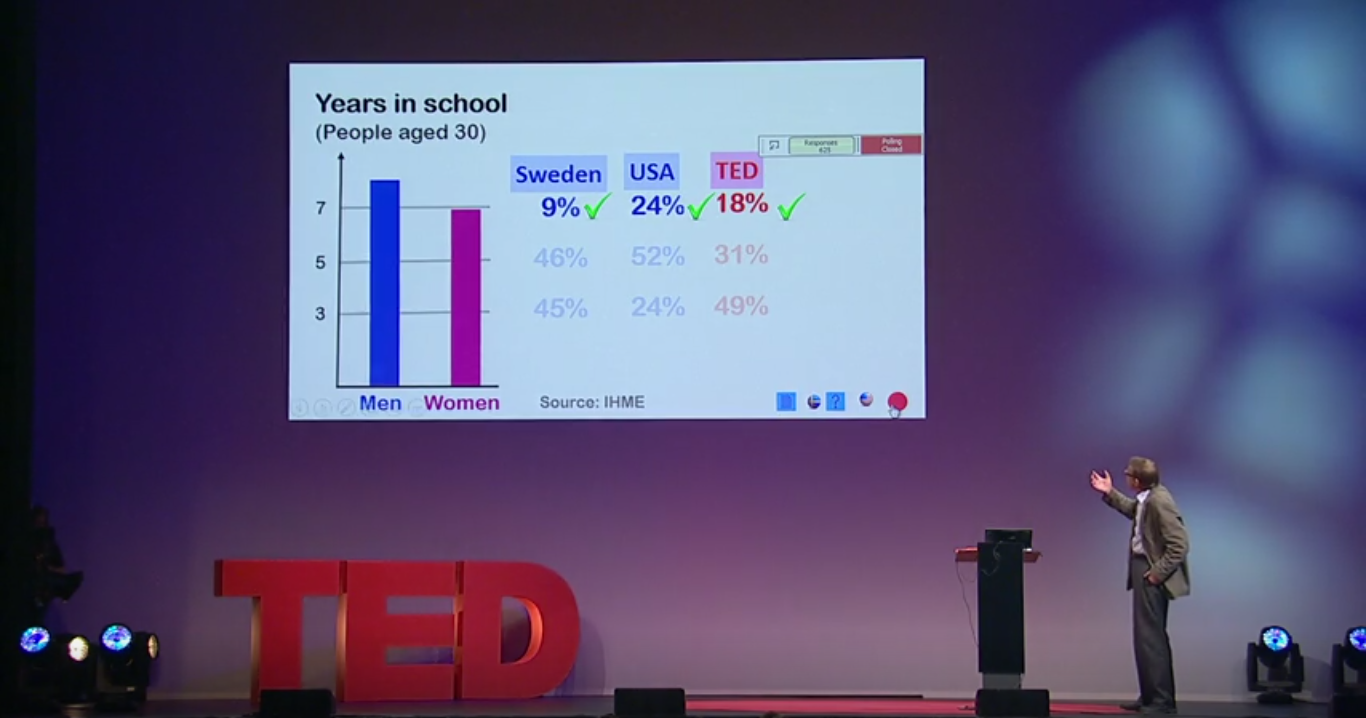 Picture 4.1 - A snippet of Hans and Ola Rosling's TED Talk Shortly after a break, we began talking about designs for an interactive dashboard that would be able to display the energy, temperature, and CO2 data. One of our main concerns for the dashboard is that it may not be the most interesting for people everyday. If it was explicitly for showing this data, people might think it's cool the first time and explore it, but they might not ever use it again. In order to keep people coming back, there needs to be some other things that interest them. Here are a few ideas we talked about:
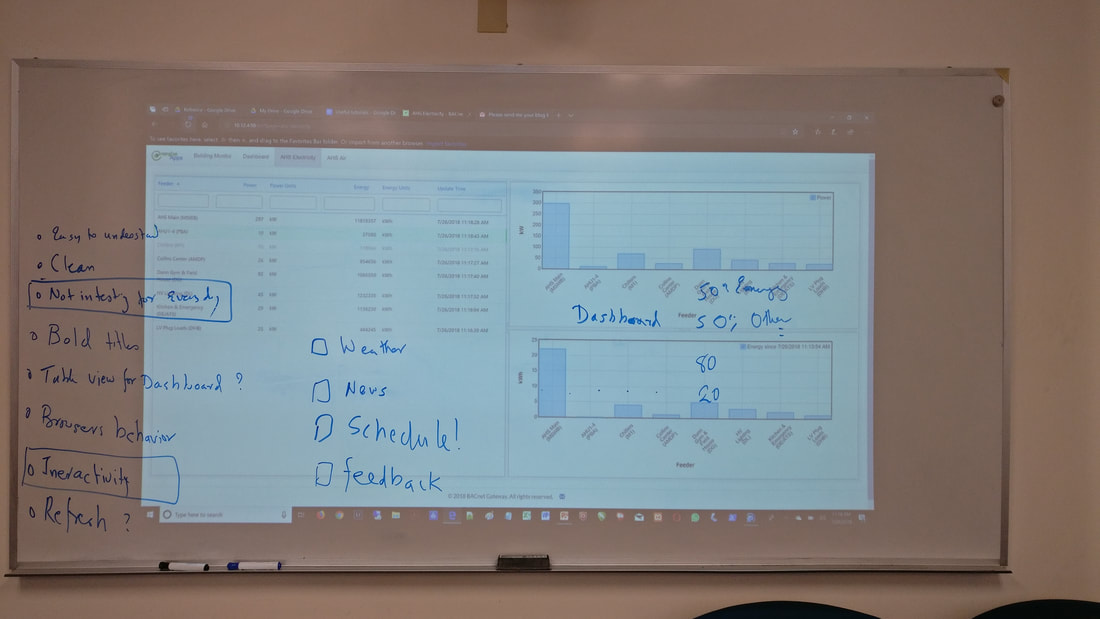 Picture 4.1 - A brainstorm of dashboard features. The current dashboard only shows the data of the school. Today we got another assignment where we are to use the buildingEnergyApi to hopefully make a GUI that lists the data of the wings of Andover High School on the second floor. So here goes a lot more reading documentation and finding packages that work...
1:20 - Found a few packages that might work. For creating a simple GUI, I could just use Tkinter, which I have tried a little bit. Two more interesting packages are Plotly and Dash (by Plotly). Plotly allows you to create many types of graphs in Python while Dash allows the creation of "beautiful web-based interfaces in Python" (quoted from their website). The best thing about Dash is that is built form Flask, which many of us have experience with.
0 Comments
Leave a Reply. |
Author
Write something about yourself. No need to be fancy, just an overview. ArchivesCategories |
 RSS Feed
