|
I completely forgot that today's meeting started at 9:00, so I got here at 10:00. I didn't miss too much other than possible time to work on yesterday's assignment. We started by going over some electrical stuff, particularly talking about the electricity diagram for Andover High School. Before seeing the transformer inside this building, we talked about three-phase voltage and then wattage conversions. Transformers also make good heaters, as they often convert high voltage (480 V) to lower voltages (120 V) by taking in a lot of wattage (1000 kW). If the transformer is 98% efficient, then there are still 2 kilowatts that are turned into heat, which is actually just about the amount that a space heater uses. Mr. Navkal also brought a toaster into the room to show how much wattage they take (Spoiler: toasters use a LOT of wattage for their size). 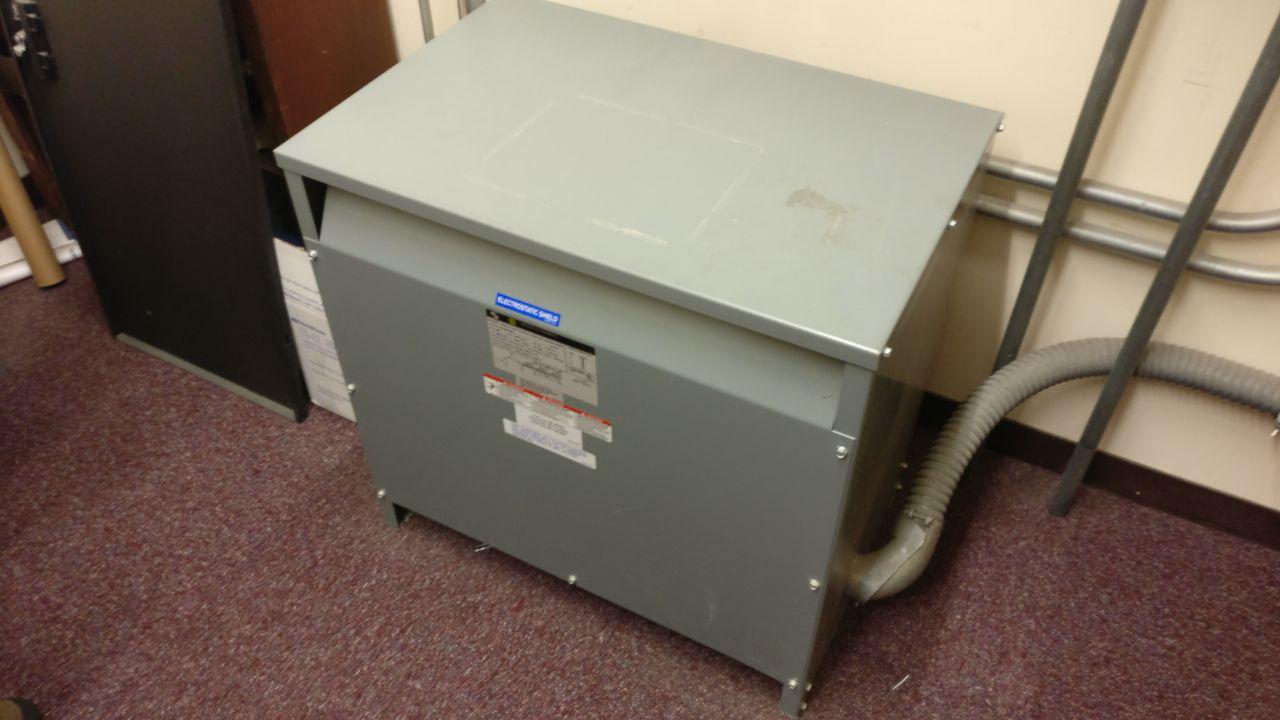 After these two hands-on experiences, we went into Panel Spy and saw that Andover High School has 26 transformers, all doing different voltage conversions. One of the largest reasons for this program is because the room numbers in AHS were manually changed about 20 years ago. All the transformers throughout the school still have the old room numbers, meaning that it is near impossible to have some place that links one room number on the transformer to the new room number in AHS. Without the work of Energize Andover, one would have to go to each transformer and find how it provides electricity to the school, but not it's significantly easier with this software.
0 Comments
For the beginning part of today, we talked about what each one of us hoped to get out of this program. I really find it cool that we get to use the coding skills we learned in computer science classes and actually apply it to real world applications, potentially seeing our work help the lives of others or help the town. After that, we watched a TED Talk about ignorance and how not to be ignorant about the world, given by Hans Rosling and his son Ola Rosling. The talk was really interesting, as we humans tend to be ignorant because of personal biases (the places where we grew up, limiting our perspective because they are small), outdated data and world views taught by teachers, and news biases. Surprisingly, one of the largest things that make us human, our intuition, guesses based upon these factors and most of the time comes to negative conclusions that the world is becoming worse, when in actuality the world is progressing and becoming better. In order to not be ignorant, we need to go against our intuition and guess that things will naturally get better with time. 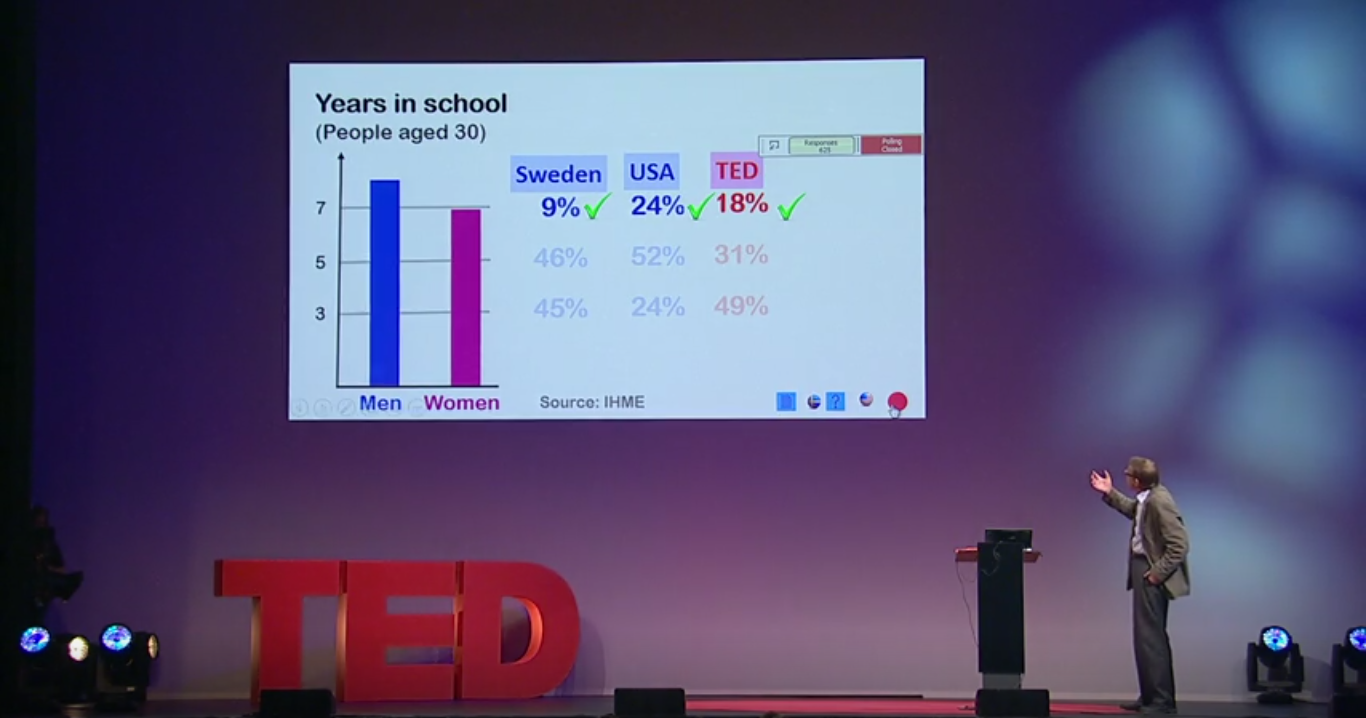 Picture 4.1 - A snippet of Hans and Ola Rosling's TED Talk Shortly after a break, we began talking about designs for an interactive dashboard that would be able to display the energy, temperature, and CO2 data. One of our main concerns for the dashboard is that it may not be the most interesting for people everyday. If it was explicitly for showing this data, people might think it's cool the first time and explore it, but they might not ever use it again. In order to keep people coming back, there needs to be some other things that interest them. Here are a few ideas we talked about:
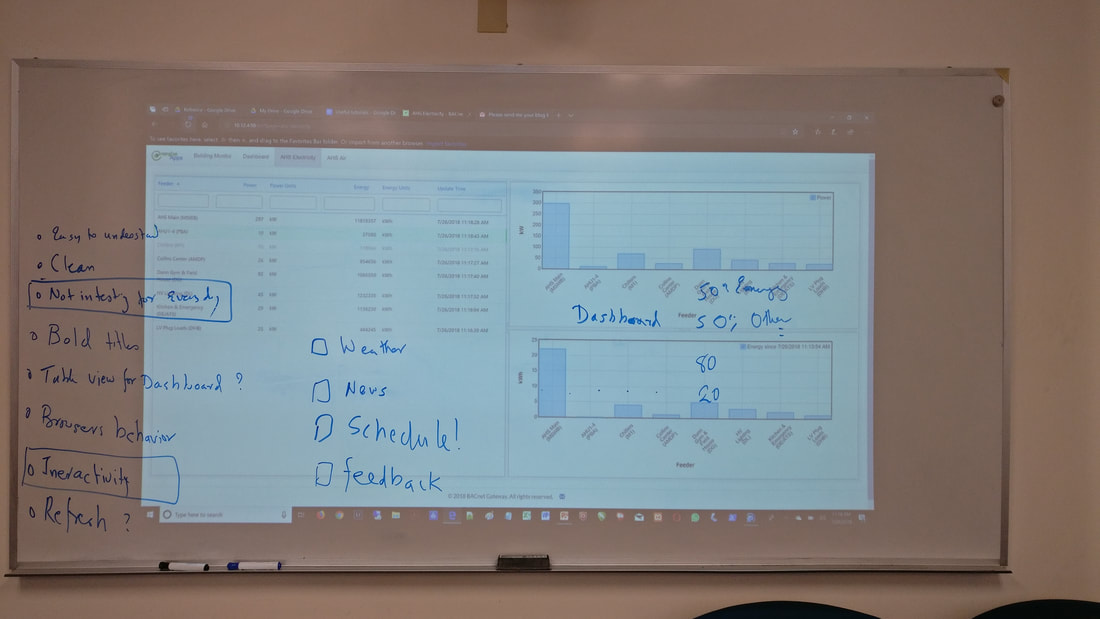 Picture 4.1 - A brainstorm of dashboard features. The current dashboard only shows the data of the school. Today we got another assignment where we are to use the buildingEnergyApi to hopefully make a GUI that lists the data of the wings of Andover High School on the second floor. So here goes a lot more reading documentation and finding packages that work...
1:20 - Found a few packages that might work. For creating a simple GUI, I could just use Tkinter, which I have tried a little bit. Two more interesting packages are Plotly and Dash (by Plotly). Plotly allows you to create many types of graphs in Python while Dash allows the creation of "beautiful web-based interfaces in Python" (quoted from their website). The best thing about Dash is that is built form Flask, which many of us have experience with. Intense Programming and Net Metering Right from the beginning of the day we began talking about code and coding. We started off by discussing the differences between waste and unusable material, as waste can still be reworked or minimized. After that, we dove straight into coding. Our first exercise was to rework the program we made yesterday and modify it so that the average CO2 was only taken from Monday to Friday. The CO2 levels can be higher on the weekends since there are far fewer people in the building. It took a while for me to get a working program, and I spent most of the time reading documentation and finding something that would get the program to work. A huge problem I encountered was how to reference the dates column within the dataframe. I could not figure out a way to access it initially, so I ended up using a different approach: filtering out the dataframes with a weekday mentioned in their dates column, then concatenating all the dataframes back as one, and finally averaging the mean. This isn't the nicest looking of ways to do it, but it worked. 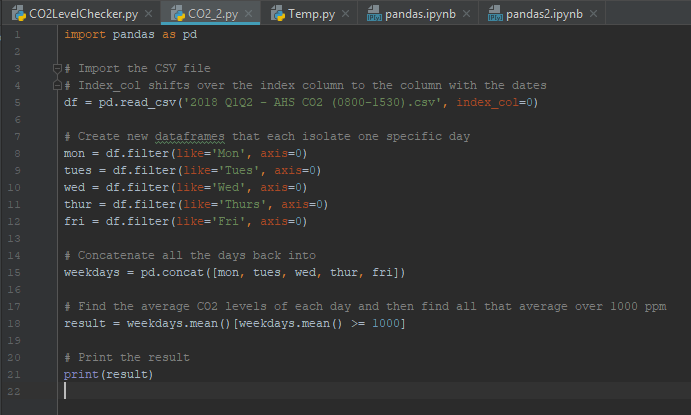 The second exercise was similar, although we had to use a different input CSV file with temperatures around the school and find which classrooms, on average, were warmer than 75 degrees Fahrenheit. My original method would not work with this data set because it relied on having the day being present in the dates column, and the dates in this data set did not have dates. I was stuck. Luckily, I was able to look at Samar's code and figured out a far more effective and efficient method of isolating the data. He found a pandas function called pd.to_datetime() that converted some time input into datetime, which could then allow him to find the day of the week and time much more easily. 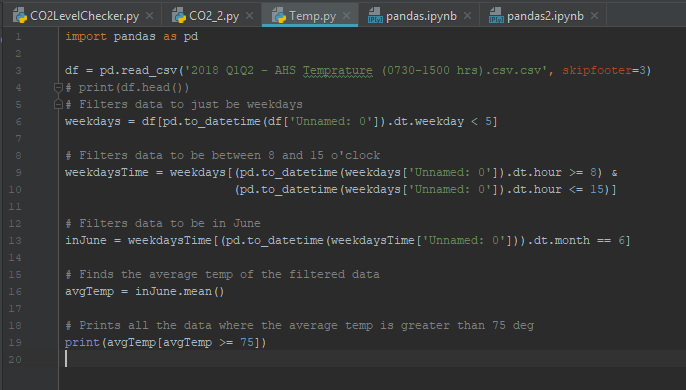 After eating lunch downstairs, Janet Nicosia came into our room and talked about Andover's electricity usage, particularly about how the high school runs 100% on solar. Essentially, Andover entered in on a deal with a local solar farm on a landfill in Palmer, Massachusetts where they would buy electricity from the solar farm (according to the cost per kWh of the solar farm) to power municipal buildings and various schools in Andover. These buildings take about 90% of the energy generated from the solar farm, and Andover gets the large majority of the electricity generated from this farm.
The best part of this deal is something called net metering, which allows any excess energy produced by the solar farm to be converted into credits for National Grid. During the summer months, where the solar panels generate more electricity than the town uses, credits are stockpiled and can be used instead of paying money during the winter months, where solar generation might be significantly lower. So far, this deal has been so good that Andover has a net gain of credits, allowing us to save a lot of money and use it for other purposes. The deal lasts for 20 years, so there's more than a decade left of money savings. I really like this deal and Andover's efforts in supporting clean energy. Even though we may not be paying for the exact energy provided by the solar farm because National Grid manages energy distribution, we are still supporting that solar company. This is the first day of the summer camp / internship (I really don't know how to describe the experience), and it was mostly introduction to the program and reasons for the program's existence. Although I didn't find it to be the most interesting, I definitely think it's necessary to have the background information before embarking on this exploration. With that being said, there were still some things that were pretty interesting. I didn't realize how much energy is being lost everywhere. We waste so much energy, sometimes just because the processes are so inefficient. For example, a car engine typically has an efficiency of about 25%, meaning that only a fourth of the input energy is used to propel the car. For an electric car, nearly all of the input electricity is used to power the motor. Using petroleum and natural gas for electrical energy is also really inefficient. To produce the same amount of energy, fossil fuels waste a ton of energy that becomes heat, which also makes them more expensive per kWh. This is the main reason why this program exists: to help the town of Andover minimize its energy usage and conserve energy, especially when we don't need to be using it. 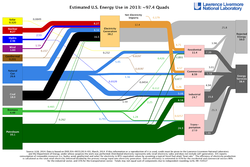 We also talked about CO2 emissions and the air conditioning systems within the town's schools. If the amount of CO2 emissions exceed 2000 ppm, then it becomes dangerous, with 4000 ppm becoming extremely dangerous. 1000 ppm and less is the sweet spot for having the air be comfortable. Another aspect of this program is to monitor the HVAC systems of the town, so we learned about how those systems work. Lastly, we ended today with coding. We modified an API to output a CSV file that could be read by a plotting program on the data providing web service. It wasn't all too difficult, but some of the headers in the CSV file had to be named exactly '"Date / Time"', '"Name Path Reference"', '"Object Name"', '"Object Value"' respectively. I think this was the highlight of the day, as I was hoping to do a lot of programming at this camp / internship. BACnet and More Coding We began today discussing the infrastructure that provides us, the students, with data that we can use to create applications and other things that might help the town. Mr. Navkal told us how we are all extremely lucky to have a town that is willing to allow us to see data about the town's buildings, as many towns don't even give this a thought. In allowing us to access the data, the web service platform limits requests to about one per second, so one student doesn't accidentally try to access the temperature 1000 times per second (which is not logical in the first place because temperature barely changes every minute). I think this is a pretty good compromise to allow us to see the town building data. The coding we did today was to create a program to take in an input set of data (we used the CO2 levels in the first half of 2018 for AHS during 8:00 AM to 3:30 PM) and output a report of all the classrooms that averaged over 1000 ppm of CO2. I initially used a for loop and iterating through the result of file.mean(), but the output of file.mean() only output one column of data, so it was not possible to access the room name alongside the CO2 level. After some research and talk with my friends, we all figured out that you could condense the code all into 3 working lines of code, as seen below: 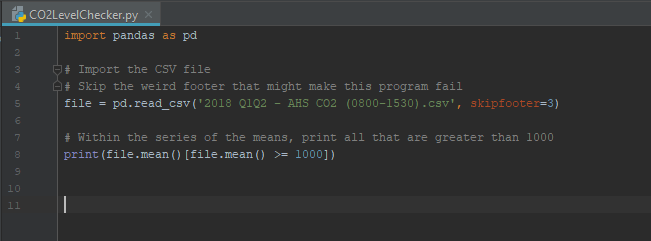 Picture 2.1 - Snippet of my final code for today. Note how condensed pandas can make the code. I am honestly really surprised by how powerful the pandas library is. Normally, if you had an array instead of a CSV, this would take so many more lines of code than written above. pandas allows you to stick everything so condensed and makes it quite a bit easier to look at.
|
Author
Write something about yourself. No need to be fancy, just an overview. ArchivesCategories |
 RSS Feed
