|
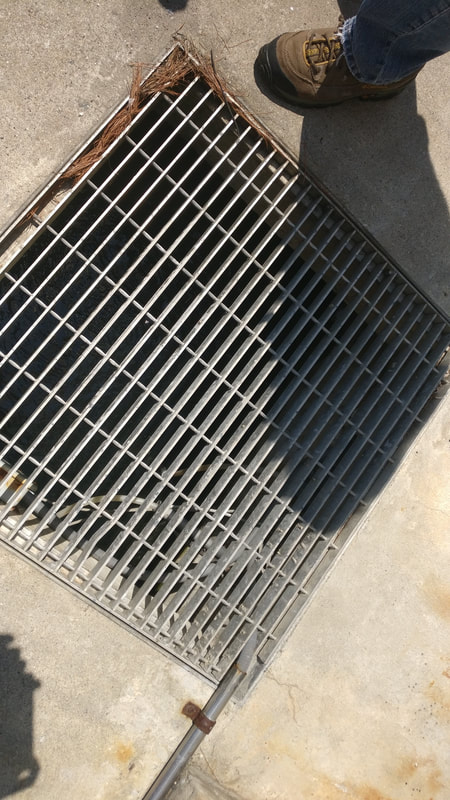
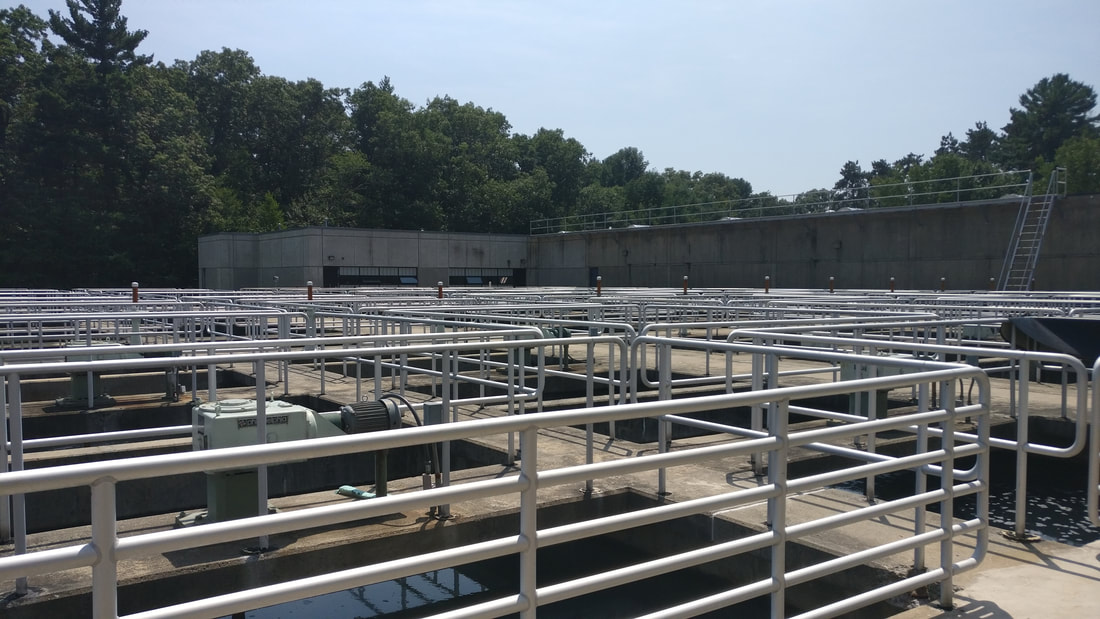
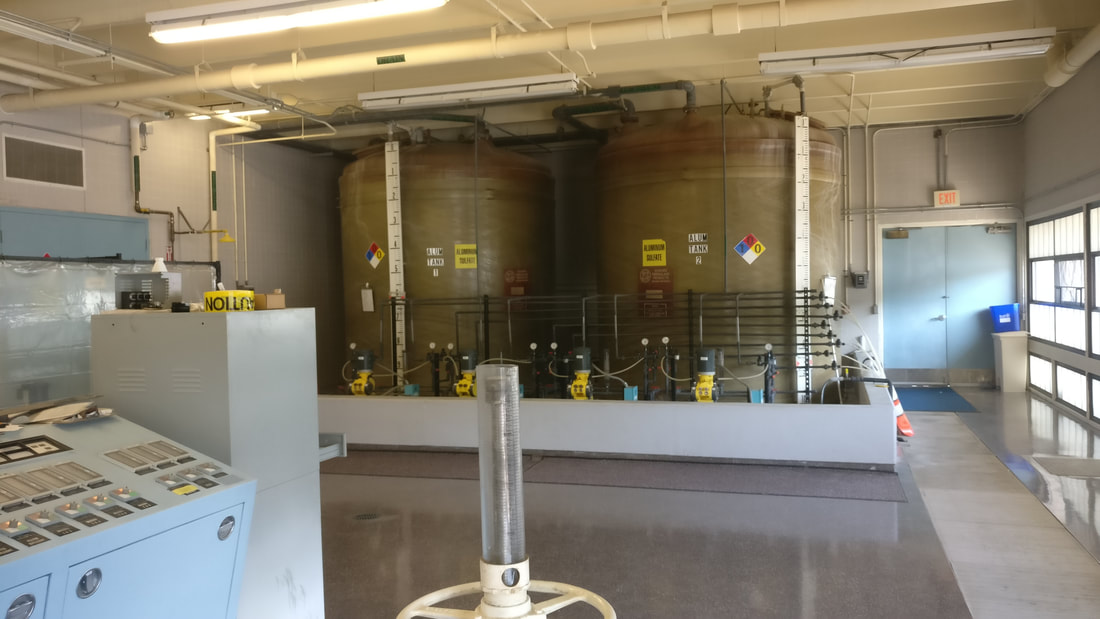
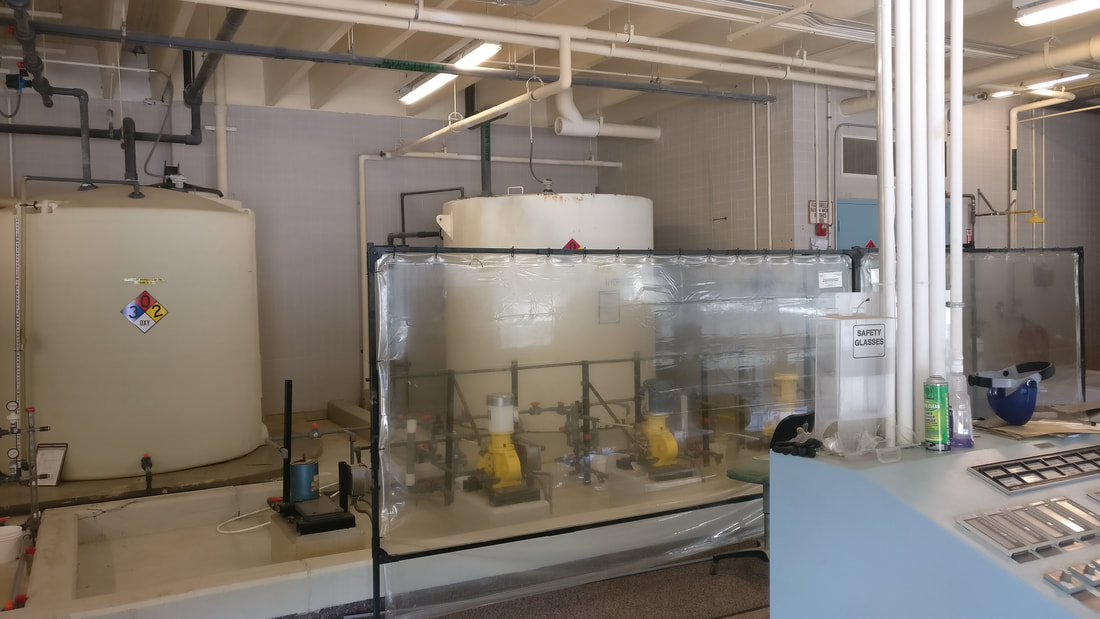
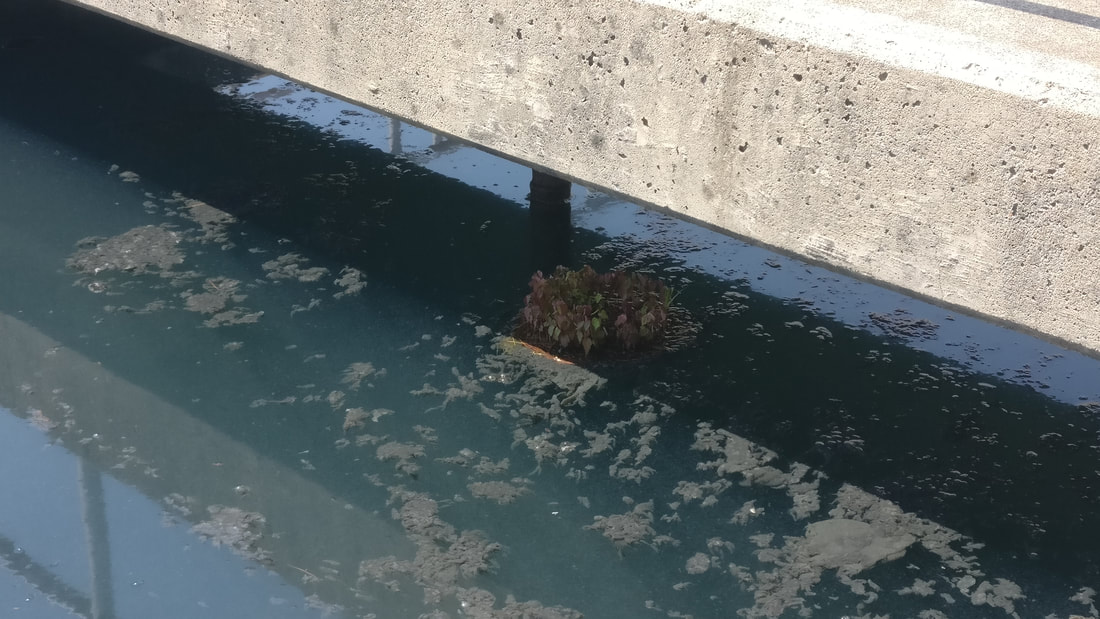
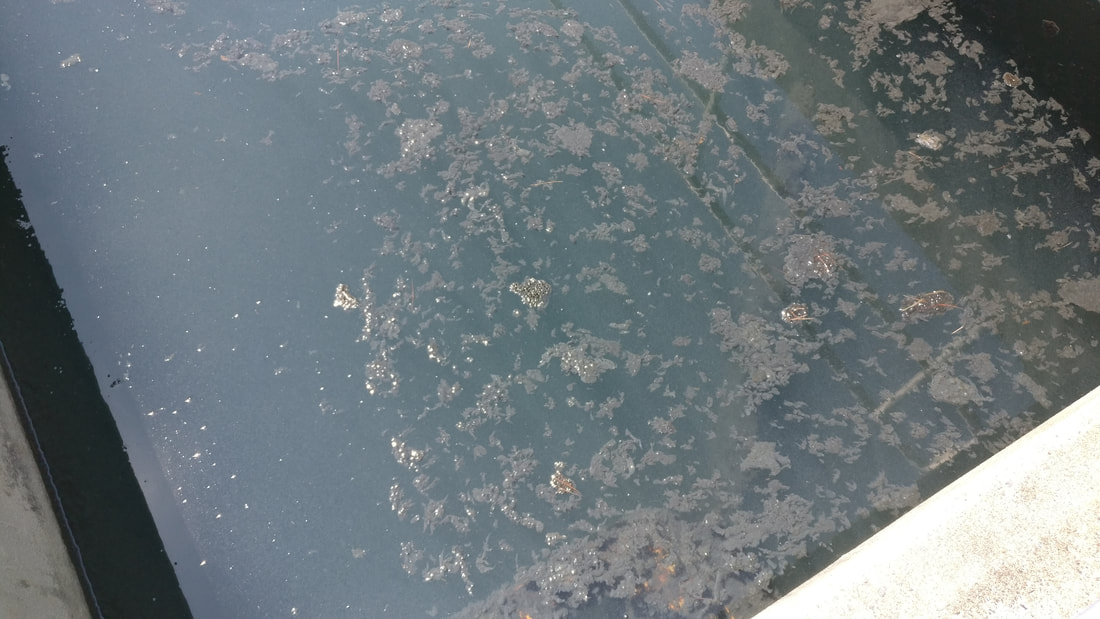
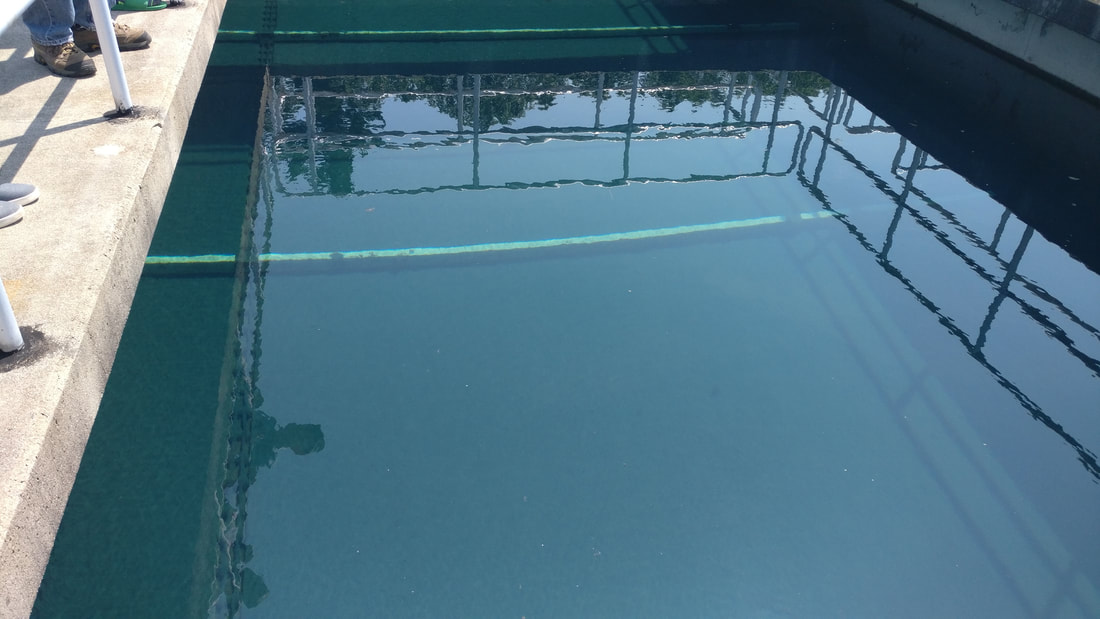
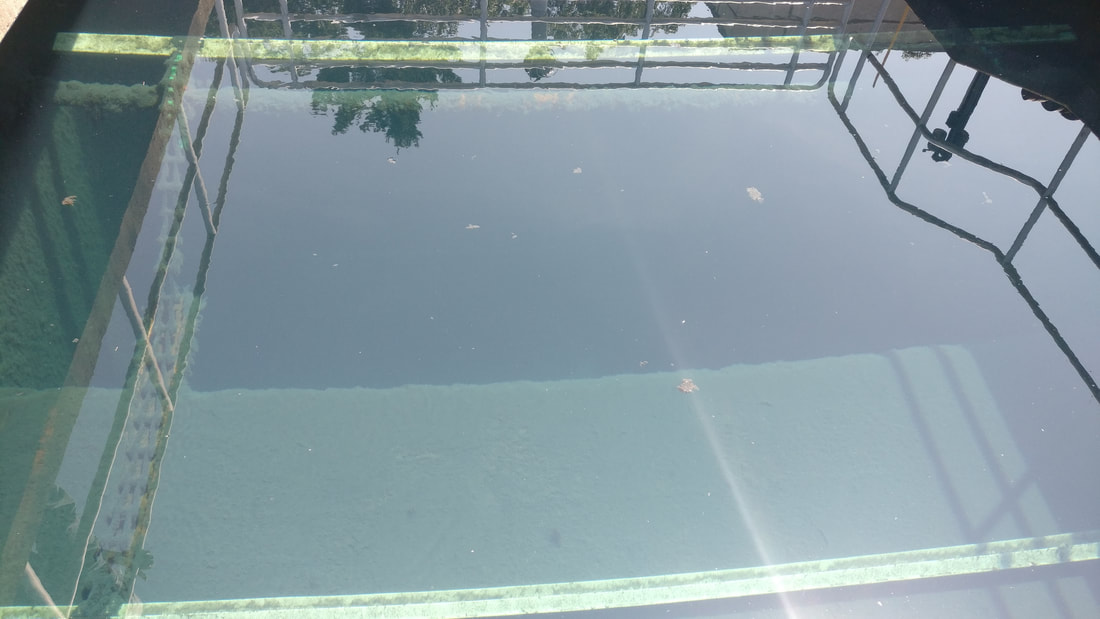
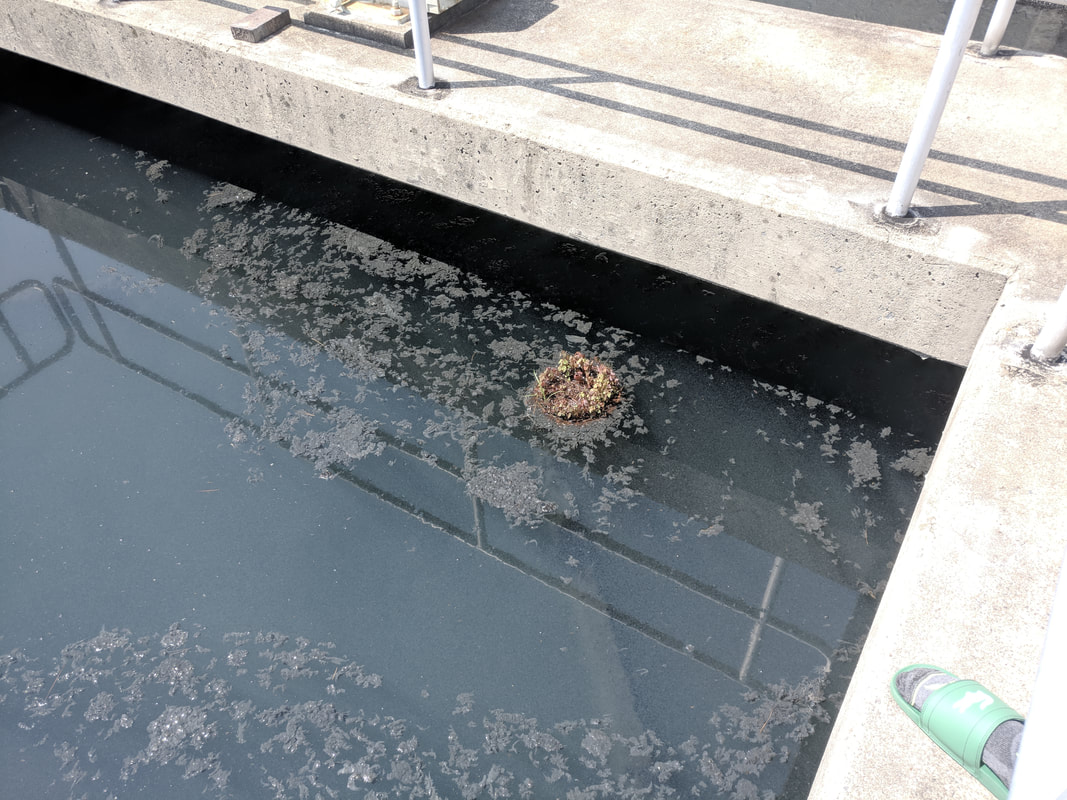
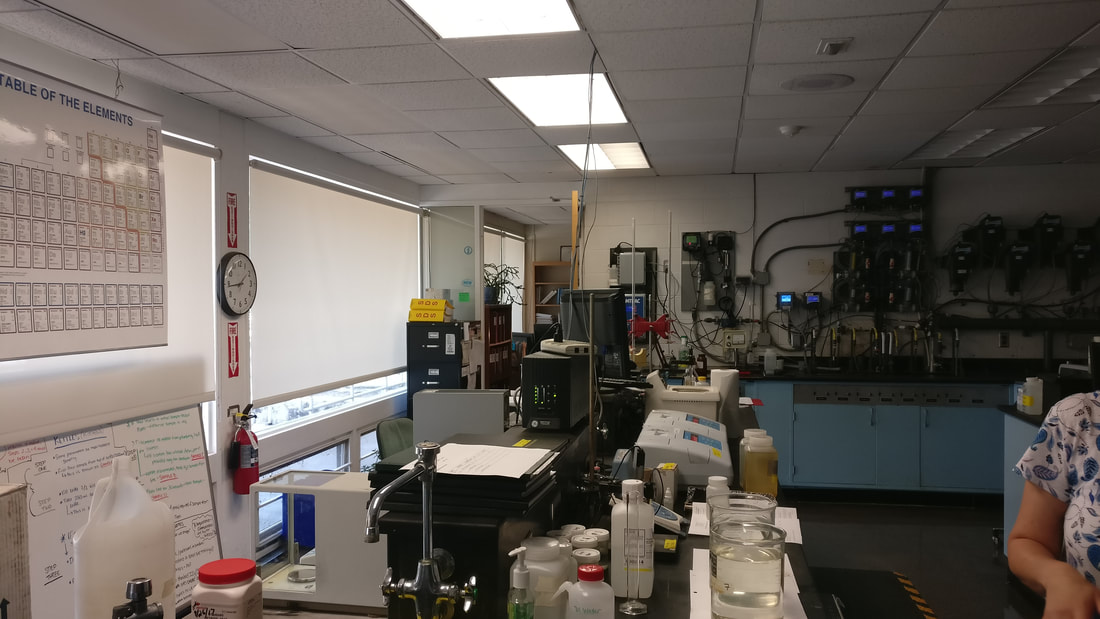
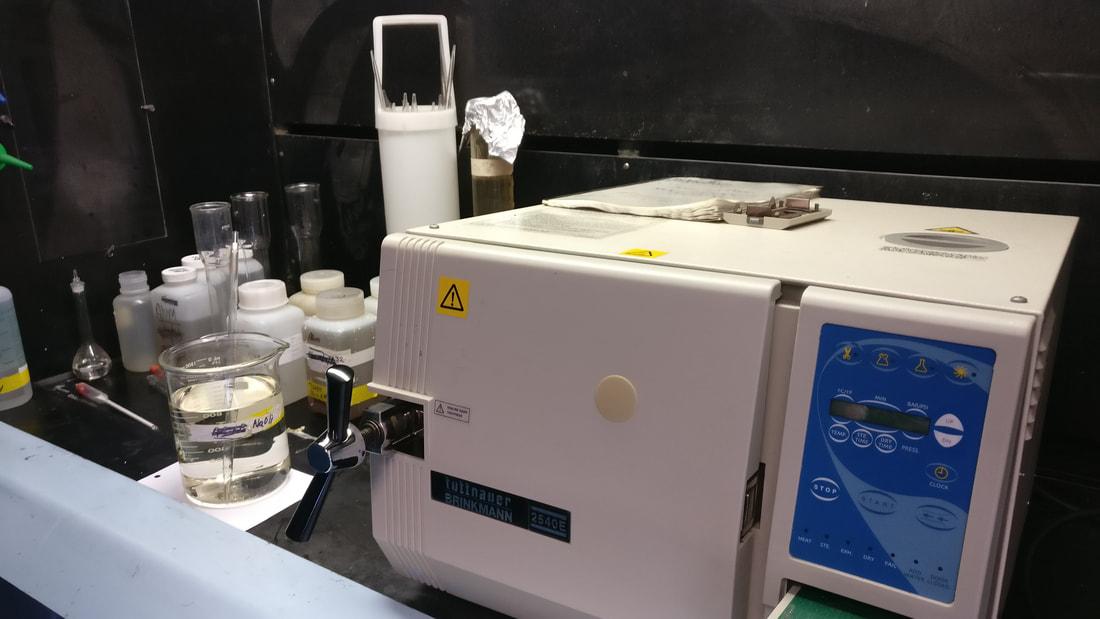
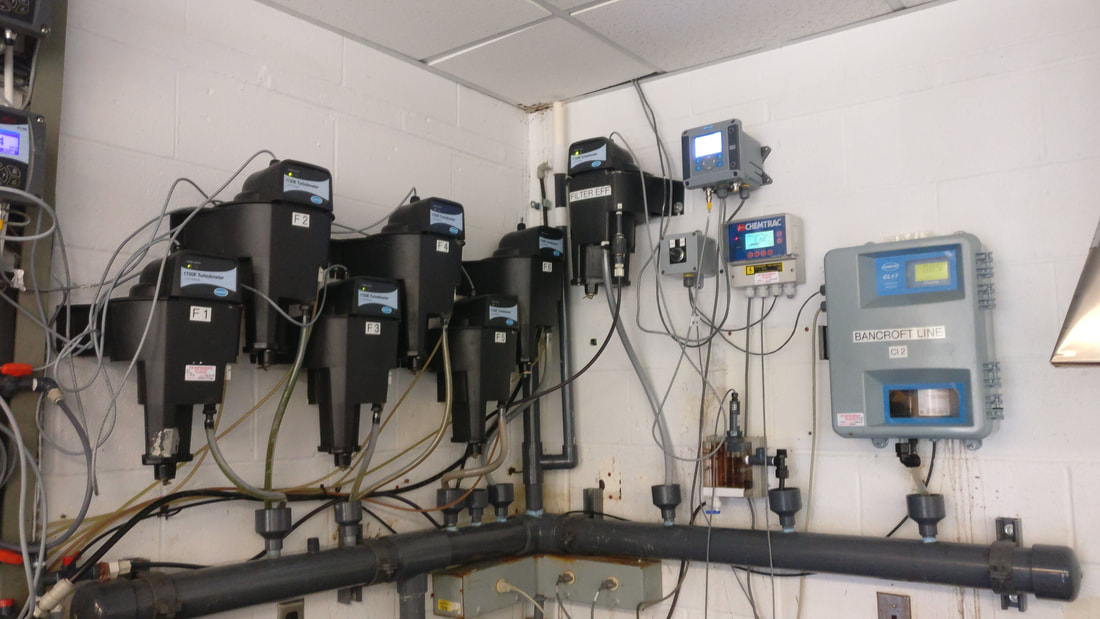
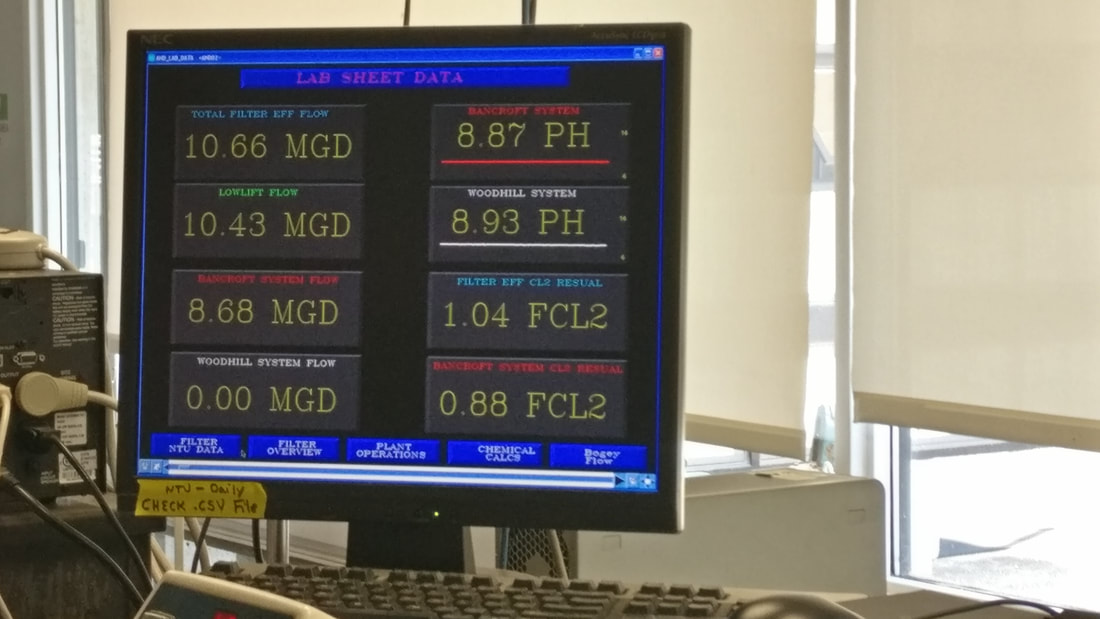
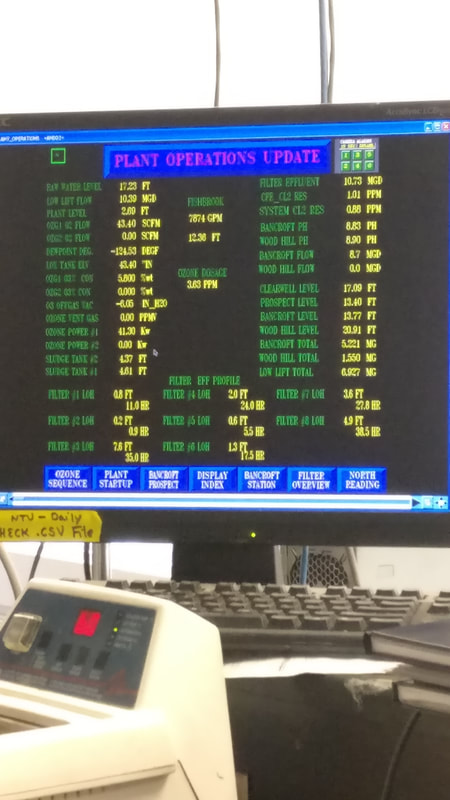
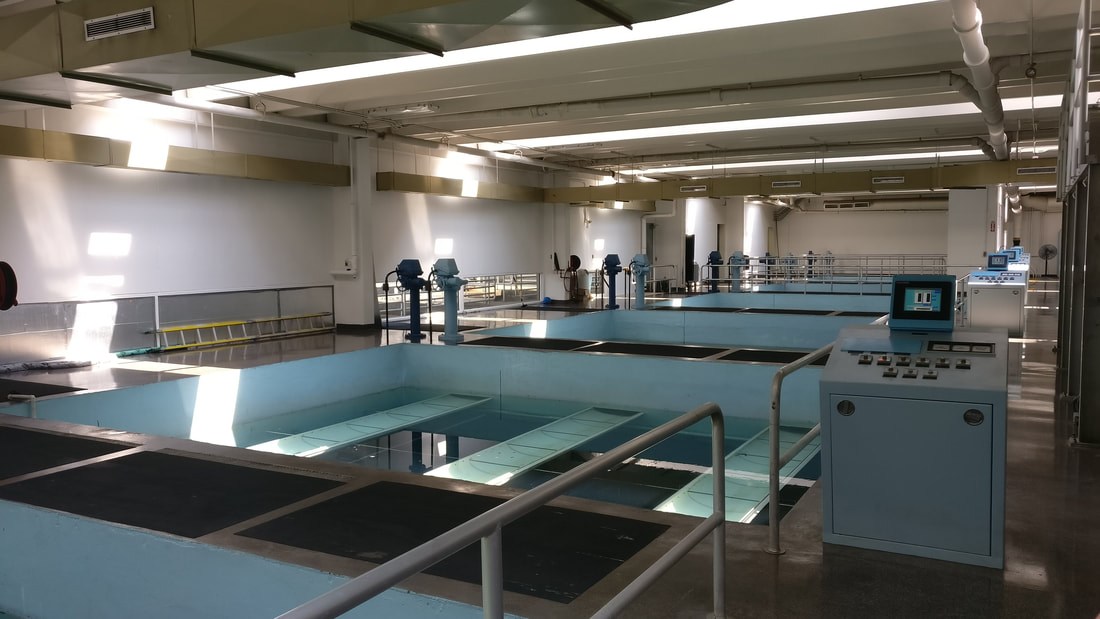
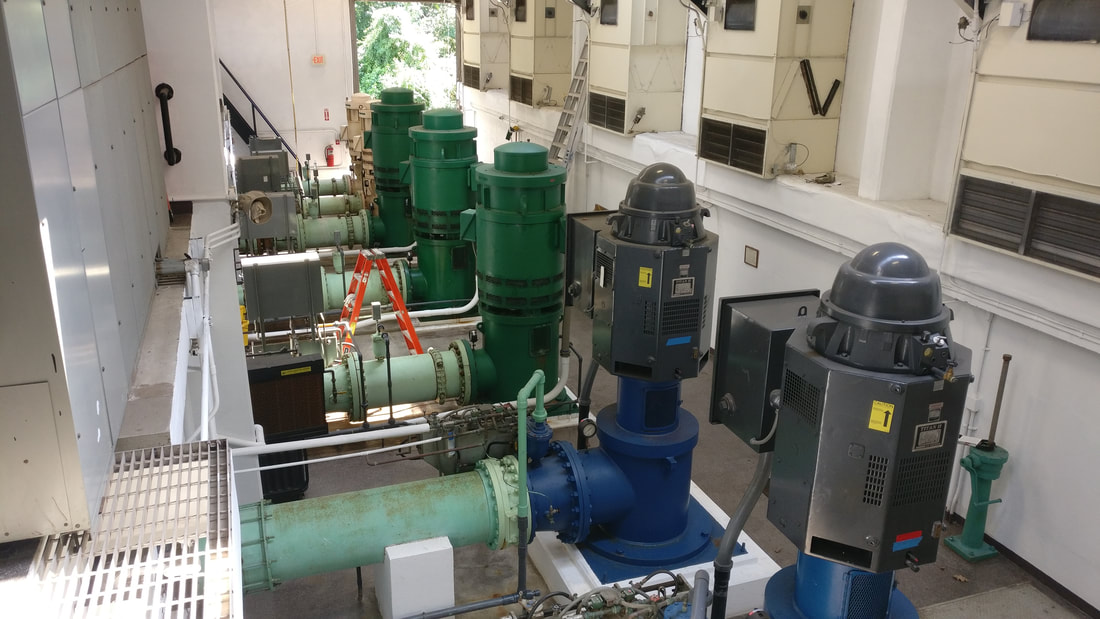
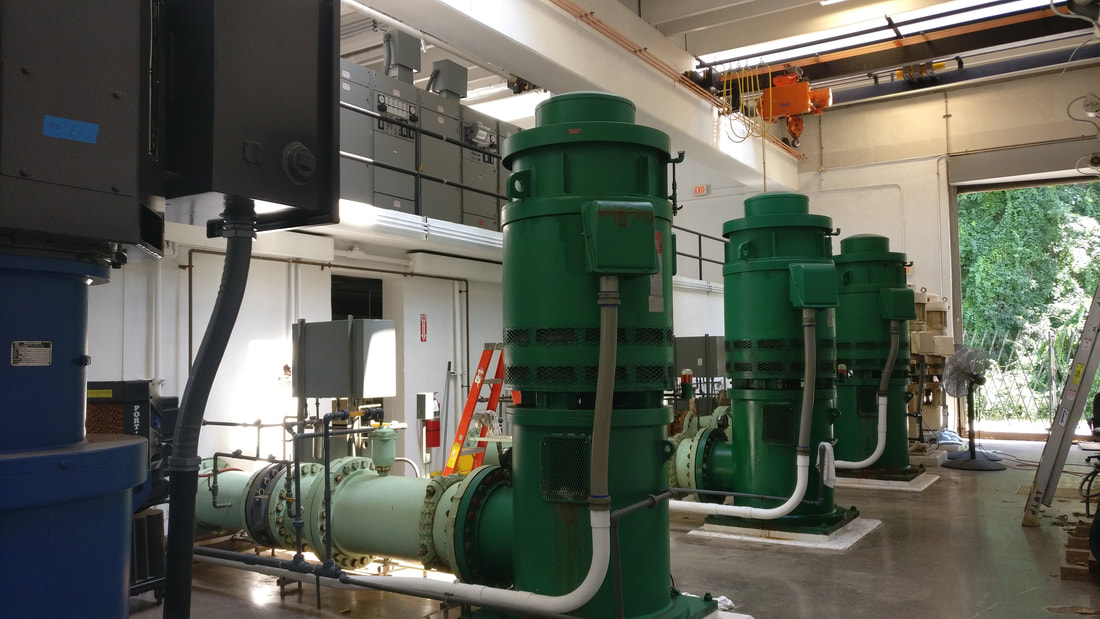
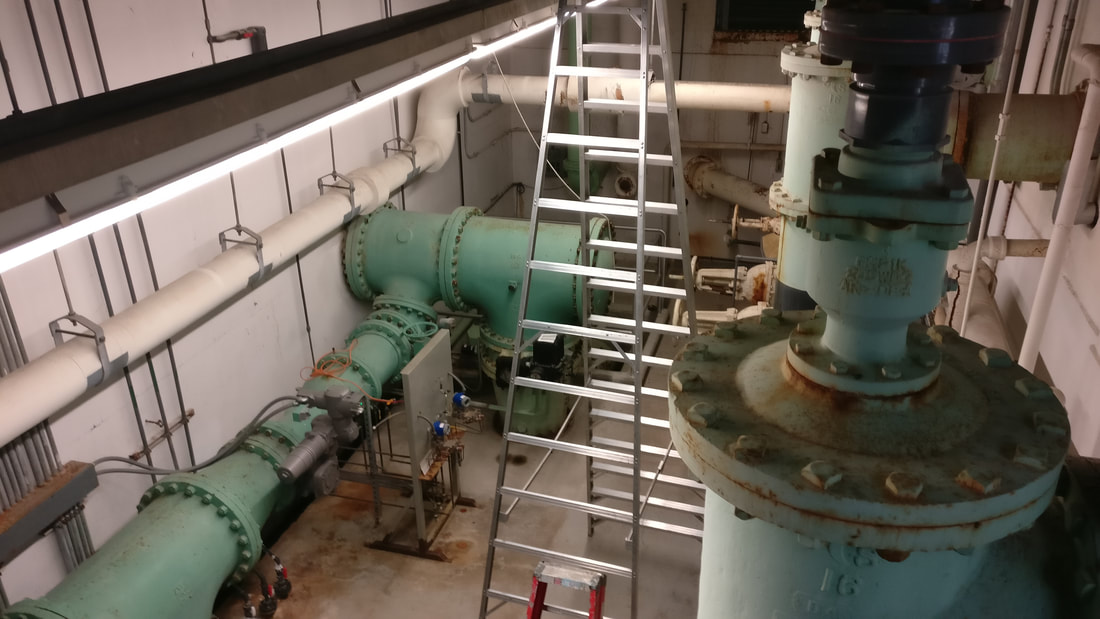
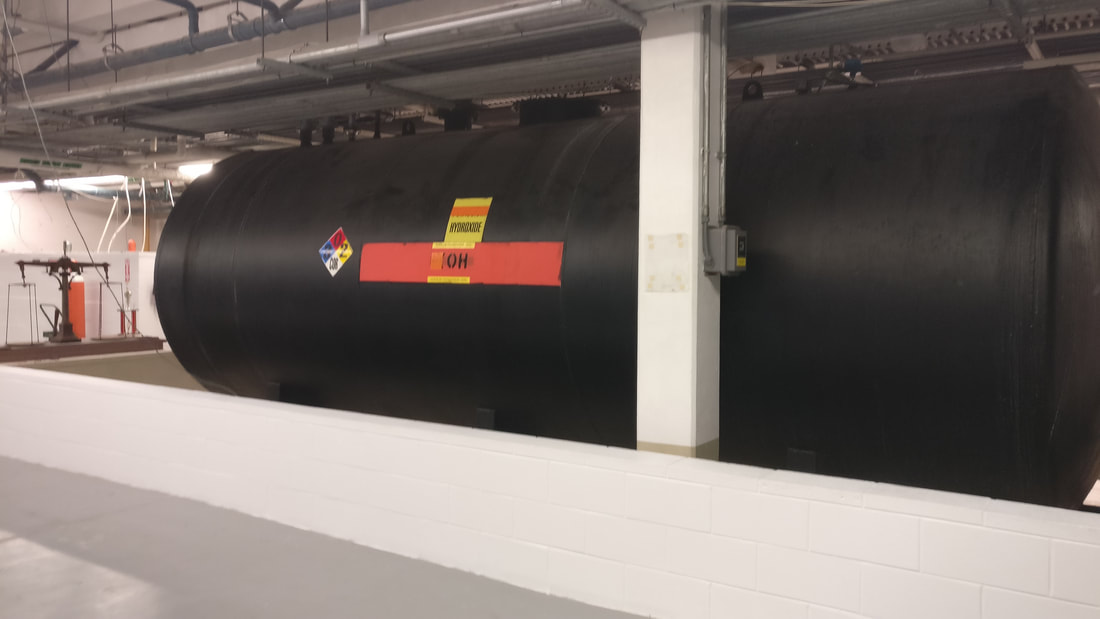
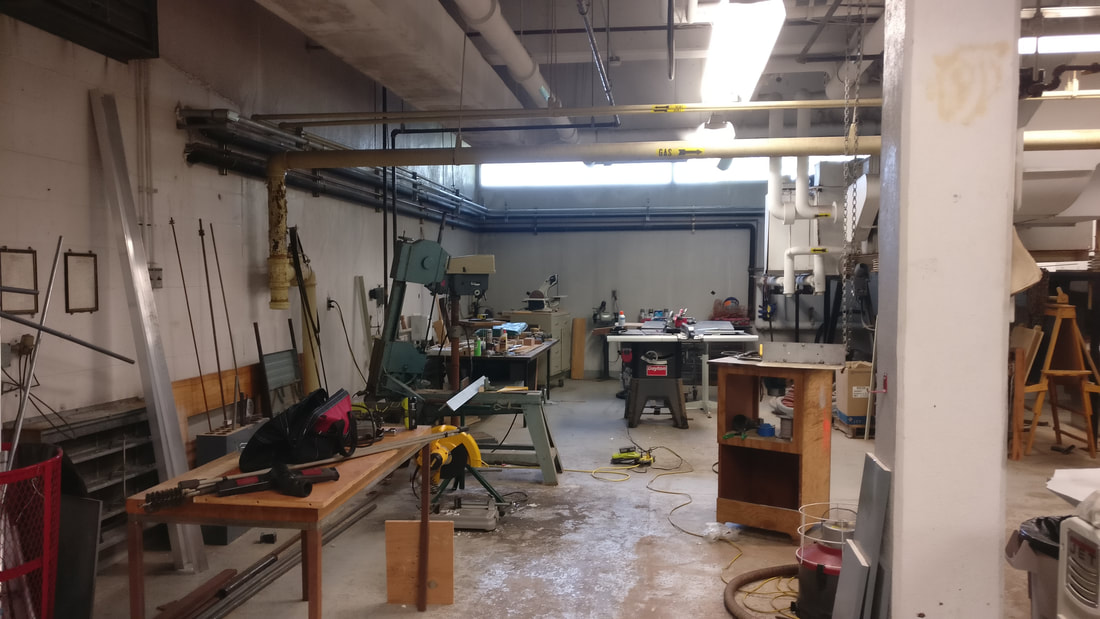
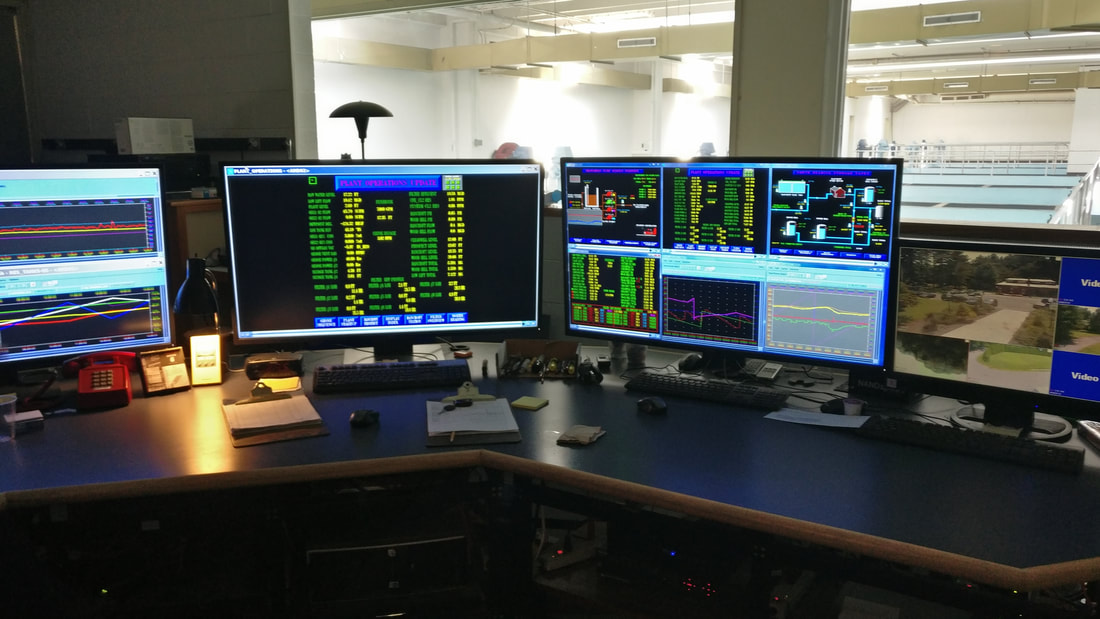
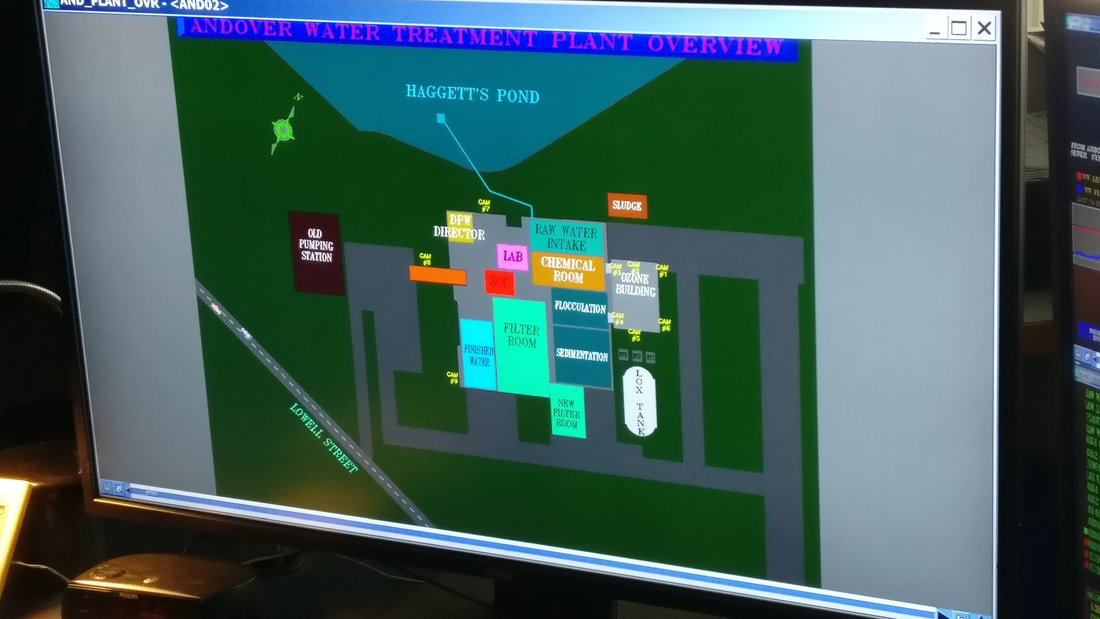
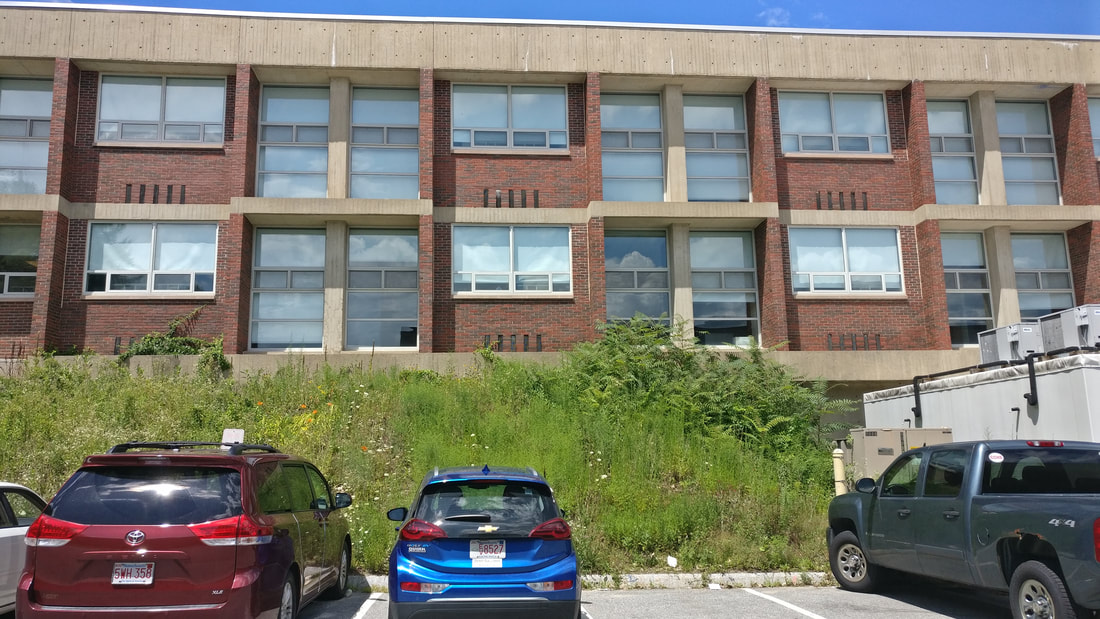
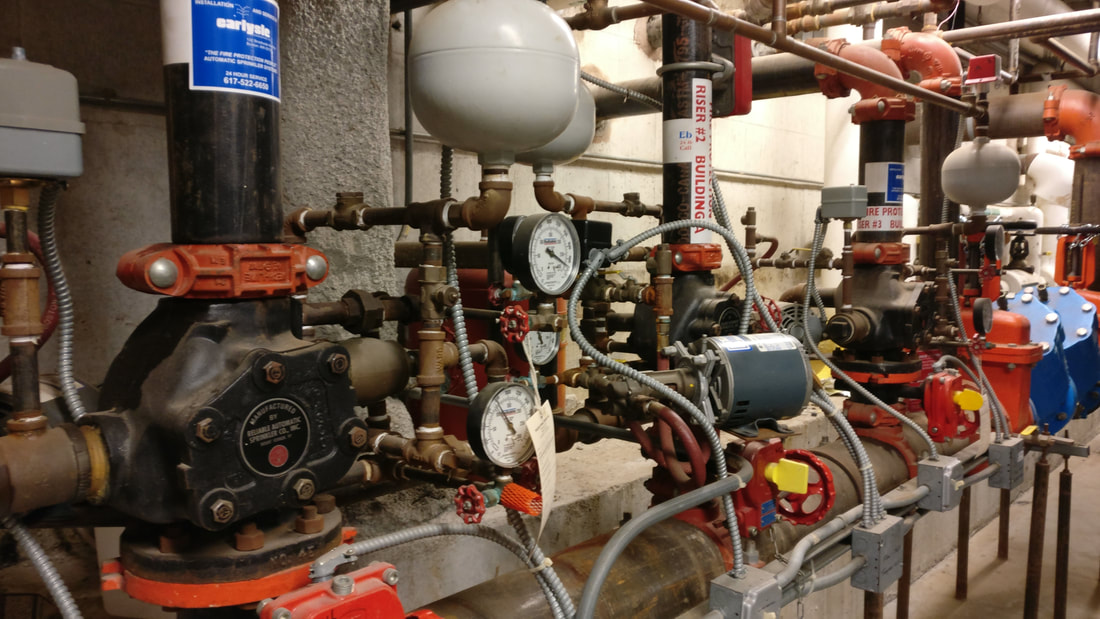
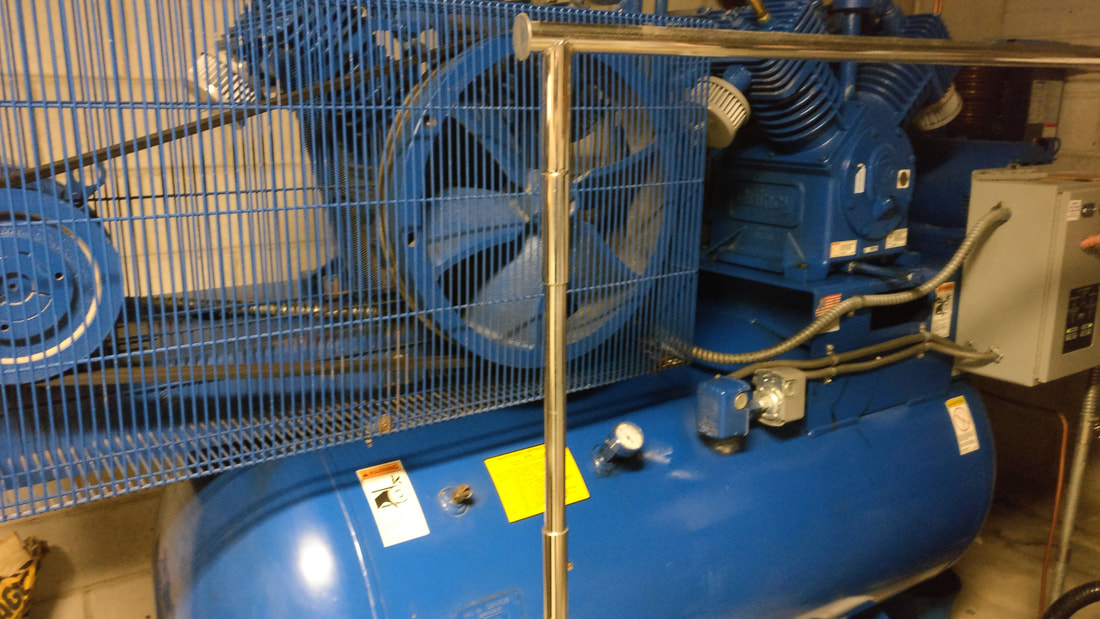
Today is the trip to the water treatment plan in Andover, so it would make sense that we would begin the day off with some background info. Most of us knew that our water came from Haggetts Pond, however, none of us knew that the water in Haggetts Pond is pumped in from the Merrimack River via the Fish Brook Pump Station. From Haggetts Pond, the water is distributed to many other tanks around the town, situated around Wood Hill and nearby Holt Hill. Also, the water tanks around the town are situated about 300 feet above Haggetts Pond. They are raised up so that they can distribute water to the houses in the town just by using the force of gravity, which is really cool. On average, each person uses about 80 gallons in Andover. In Africa, they use a lot less (5-20 gallons) and in Europe, they use about 30-40 gallons per day. Based on these numbers, this is also another area that we reduce our usage in. Of all the water usage in the town of Andover, most of the water (60%) was spent on residential uses, a significant amount higher than used by the town itself (6%). We were back to working on code after the first hour passed. I really dislike the complexity of working with Tkinter, as the way it works is just extremely annoying and requires so many work arounds just to get a minimum product. Now reviewing the time I spent working with it, I couldn't figure out how to run things while the window still works, so I had to learn multithreading. Since multithreading didn't work, I switched to using multiprocessing, but I couldn't get variables to work. I had to learn how to better use datetime because the updating things didn't work, and everything is just so much more complex than I felt it should be. As for the problem I had yesterday, I managed to find a fix. Multiprocessing allows variables to be passed between processes using Value and Array, which was simple enough to use, but I wish I could've figured that out earlier. After that, it worked like a charm and acts as intended. 2018-08-06 15:34:56.073720 Starting update_data process 2018-08-06 15:34:56.073720 2018-08-06 15:35:56.168666 Change in time: 60 Update started Staring Tkinter application 0.0 0.0 2018-08-06 15:34:57.092139 Updating Data Wing - D Floor - 3 Label Facility Temperature CO2 Wing Floor 49 335 ahs 3001848 3001836 D 3 50 337 ahs 3001822 3001810 D 3 51 339 ahs 3001796 3001784 D 3 52 341 ahs 3001770 3001758 D 3 53 343 ahs 3001744 3001732 D 3 54 345 ahs 3001718 3001706 D 3 55 347 ahs 3001692 3001680 D 3 56 349 ahs 3001666 3001654 D 3 57 351 ahs 3001489 3001477 D 3 Facility - ahs | Room - 335 Room 335 --> Temp - 82.701416015625, CO2 Lvl - 692.84033203125 Facility - ahs | Room - 337 0.0 0.0 Room 337 --> Temp - 85.140625, CO2 Lvl - 763.8154296875 Facility - ahs | Room - 339 0.0 0.0 Room 339 --> Temp - 83.427978515625, CO2 Lvl - 668.96630859375 Facility - ahs | Room - 341 0.0 0.0 0.0 0.0 Room 341 --> Temp - 84.07672119140625, CO2 Lvl - 686.499755859375 Facility - ahs | Room - 343 0.0 0.0 Room 343 --> Temp - 82.9609375, CO2 Lvl - 462.05810546875 Facility - ahs | Room - 345 0.0 0.0 Room 345 --> Temp - 82.85714721679688, CO2 Lvl - 1226.28564453125 Facility - ahs | Room - 347 0.0 0.0 Room 347 --> Temp - 82.15652465820312, CO2 Lvl - 603.296630859375 Facility - ahs | Room - 349 Room 349 --> Temp - 83.27230834960938, CO2 Lvl - 627.2353515625 Facility - ahs | Room - 351 0.0 0.0 Room 351 --> Temp - 83.58367919921875, CO2 Lvl - 591.97412109375 83.35303751627605 702.5524088541666 702.6 83.4 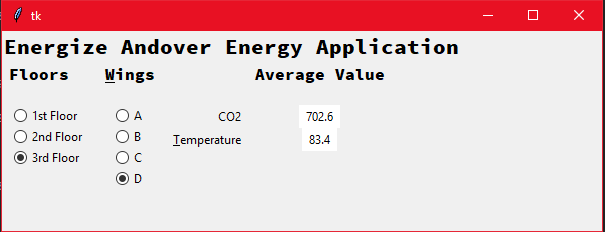 Console Output and Picture 10.1 - Successful minimum viable product. Each 0.0 represents 10 seconds that has passed and an update of the values under "Average Value". At the very end of the console output, 702.6 and 83.4 were printed, indicating that the variables were successfully received by the main while loop and put into the Tkinter application. Soon after lunch, we took a trip to the Haggetts Pond water treatment plant, and were given a tour by Karen around the facilities. The trip began outside the facility, where they separated the organic matter from the water. They first start off in a separate room in the plant which ozonates the water to help disinfect the water and kill the bacteria that live inside of it. Next, the water is pumped into various chambers, starting with a chamber containing activated carbon to remove other particular matter, then to another where aluminum sulfate (a coagulation agent) is added. The aluminum sulfate helps coagulate the organic matter in the water to form clumps of flog. Finally, the water is sent to another chamber where sodium hydroxide (NaOH, also referred to by Karen as caustic) is mixed in to raise the pH of the water to about 8.8, which helps keep it safer when traveling through pipes to its destination. Somewhere along the process chloride and fluoride are added. Next, we went into the lab, where Allen (the senior chemist) was working. He's retiring in a few months after about 28 years of vigilant work to ensure that the water is suitable for drinking. The last part of this trip were the last part of the water refinement and water exporting places. After the water is treated outside, it is sent inside to another filtering station where the water is filtered through three feet powder activated carbon to further remove things in more chambers. Sometimes, to clean the carbon filters, they backwash the system by forcing air through the carbon to remove impurities in the carbon, which land on small trenches and are disposed. After walking down some stairs, we saw the water pumps that pump the water to the water tanks around the town. The three green ones send it to the Bancroft site, the two blue newer ones send it to Woodhill, and the last two beige ones send it to Prospect Hill. Most of the time, only two of the three Bancroft pumps are working at once since they don't need all three on at once. There are three pumps because the Bancroft supply provides water for residents around the center of town, which make up most of the residents in Andover. Walking down another flight of stairs, we got to the underground portion of the water treatment facility. This underground segment contained the emergency generator and boiler rooms. Each one of these rooms also serve another purpose, as there is limited space in the facility and there needs to be accommodations for overnight operators. The plant has one overnight operator a night who lives at the plant for one day out of every five (because there are five total operators) so that they can monitor the overnight processes. They don't need to do this during the winter, but during peak water demand in the summer, they need the plant to be running 24/7. Our final destination in this tour was the control room, which looked extremely cool. In the control room, the operator sits and monitors a total of five TV-sized displays that contain information about the plant processes and other data. We also saw a map of the entire facility on the central display. Overall, I think I liked this trip more than the trip to AHS. Both were extremely interesting, but the water treatment plant trip just resonated more with me and seemed to be a lot more interesting. The effort they go through in the plant to distribute quality water that we take for granted is astounding, and I have a much larger appreciation now for the tap water.
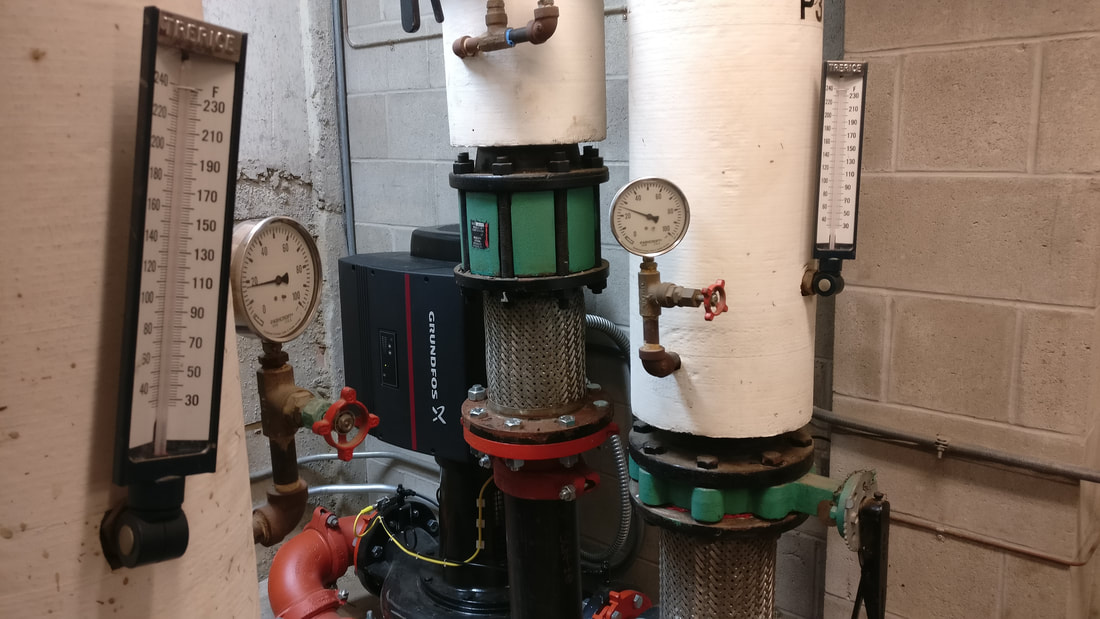
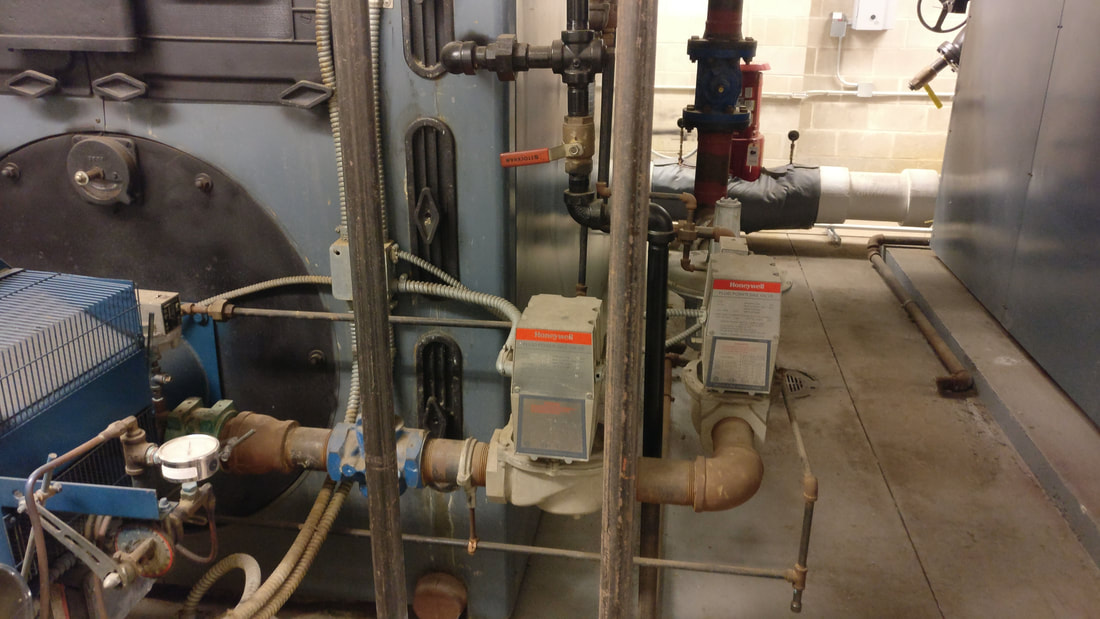
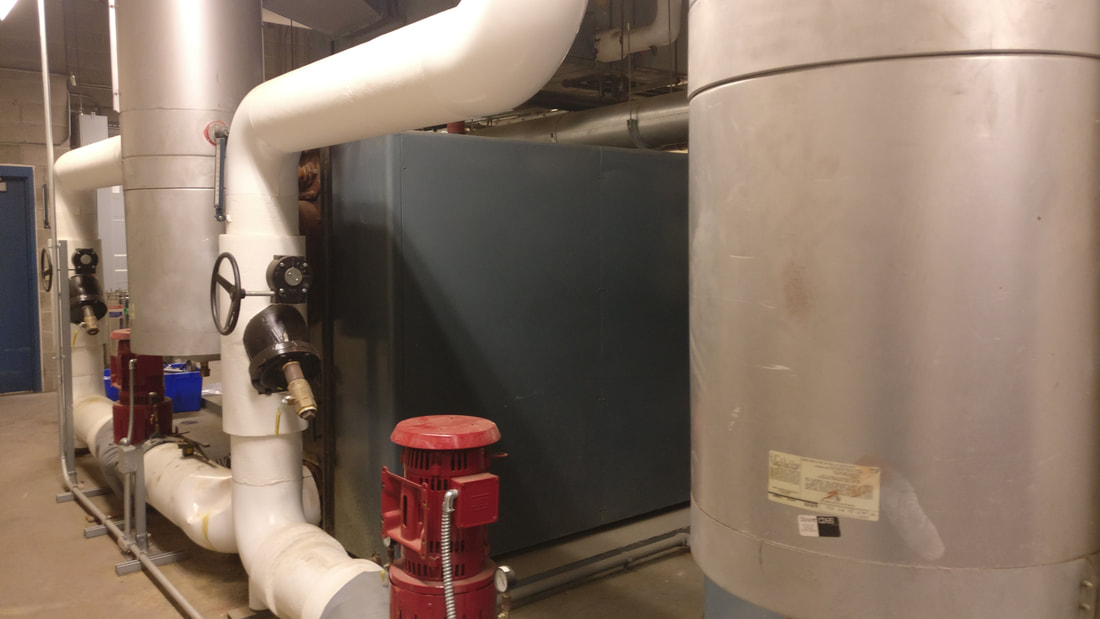
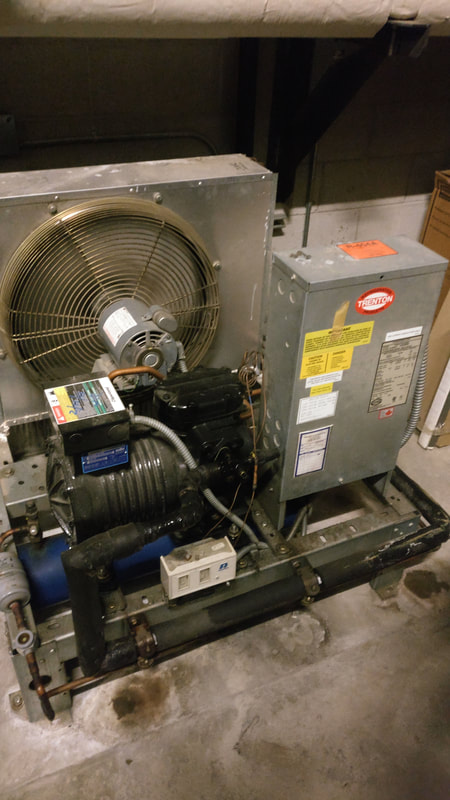
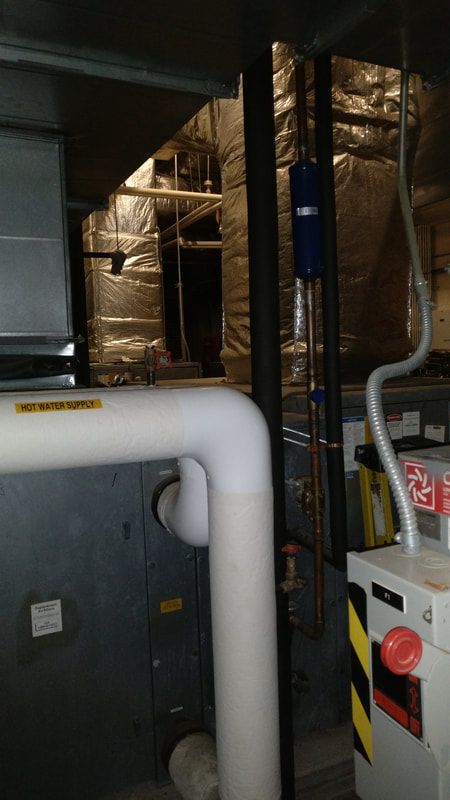
0 Comments
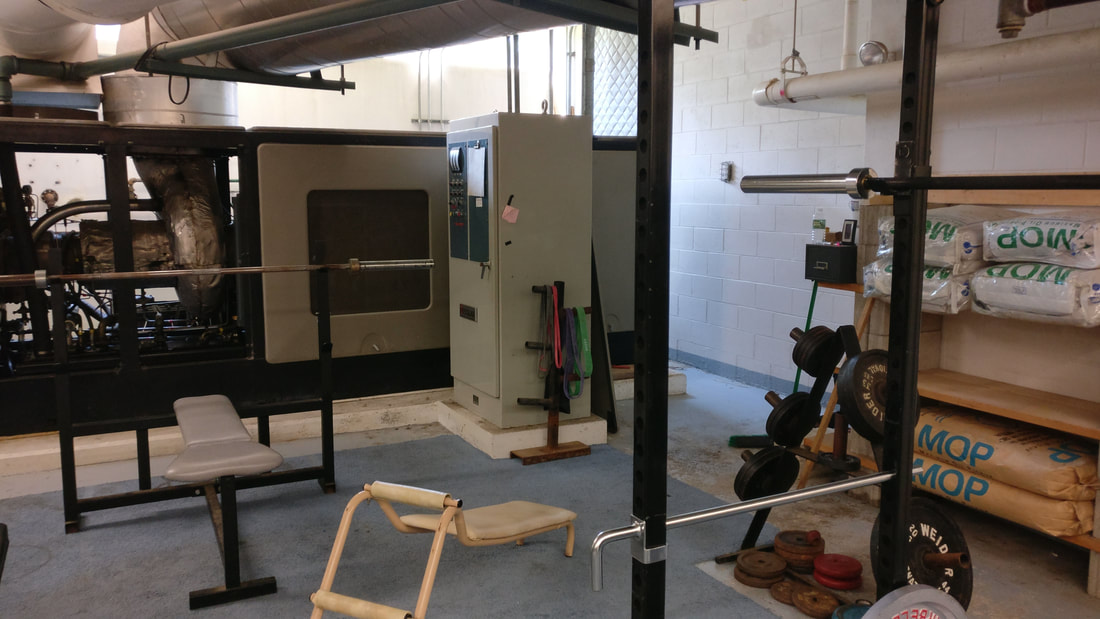
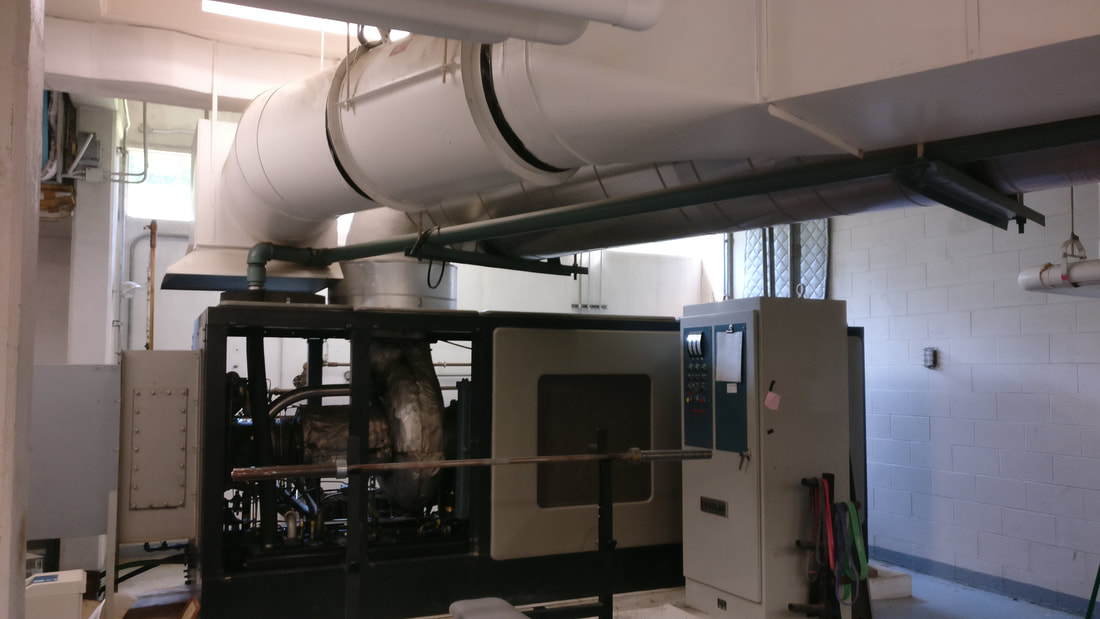
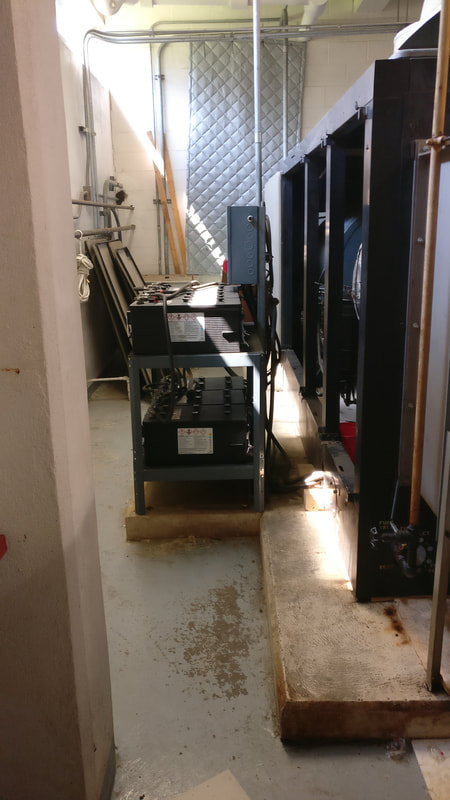
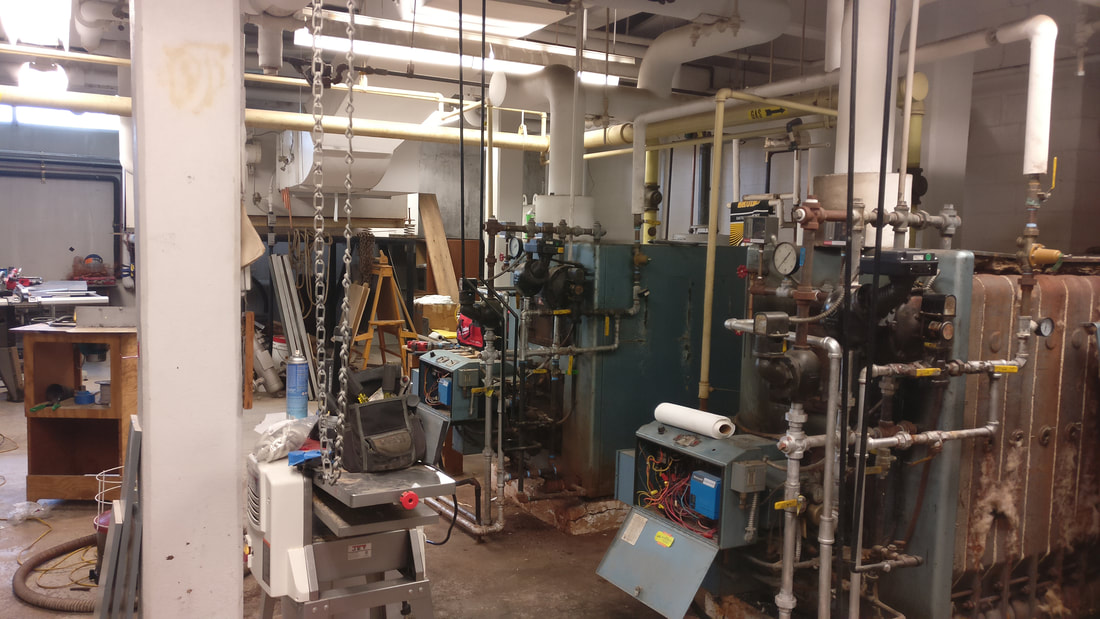
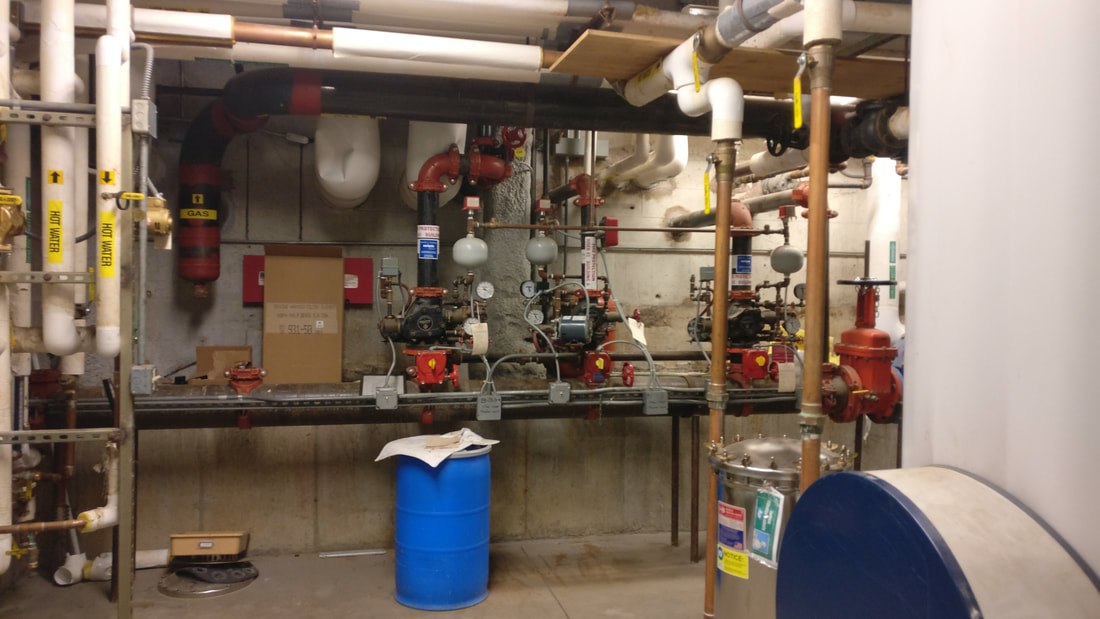
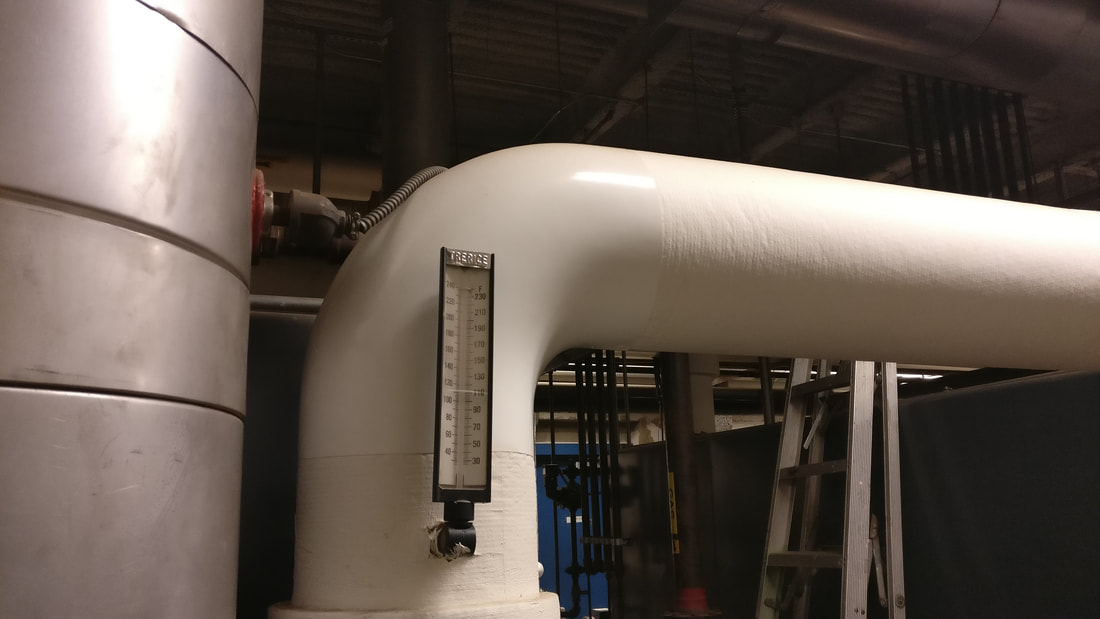
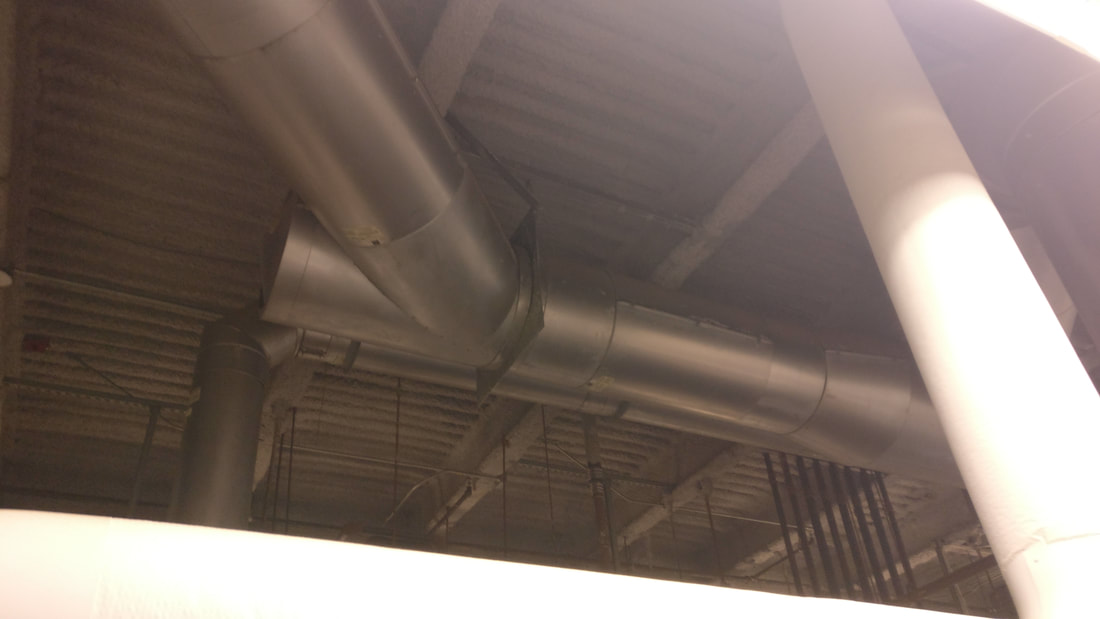
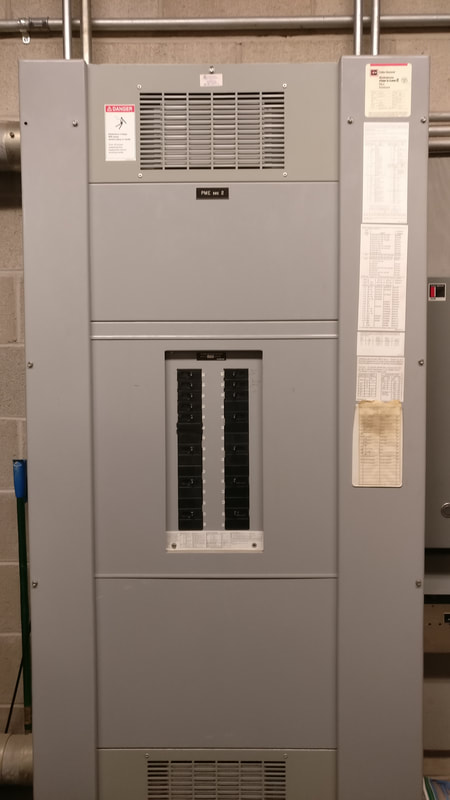
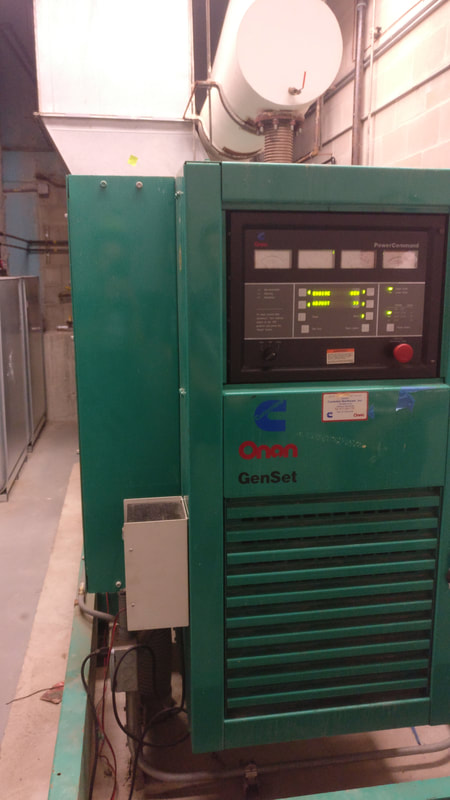
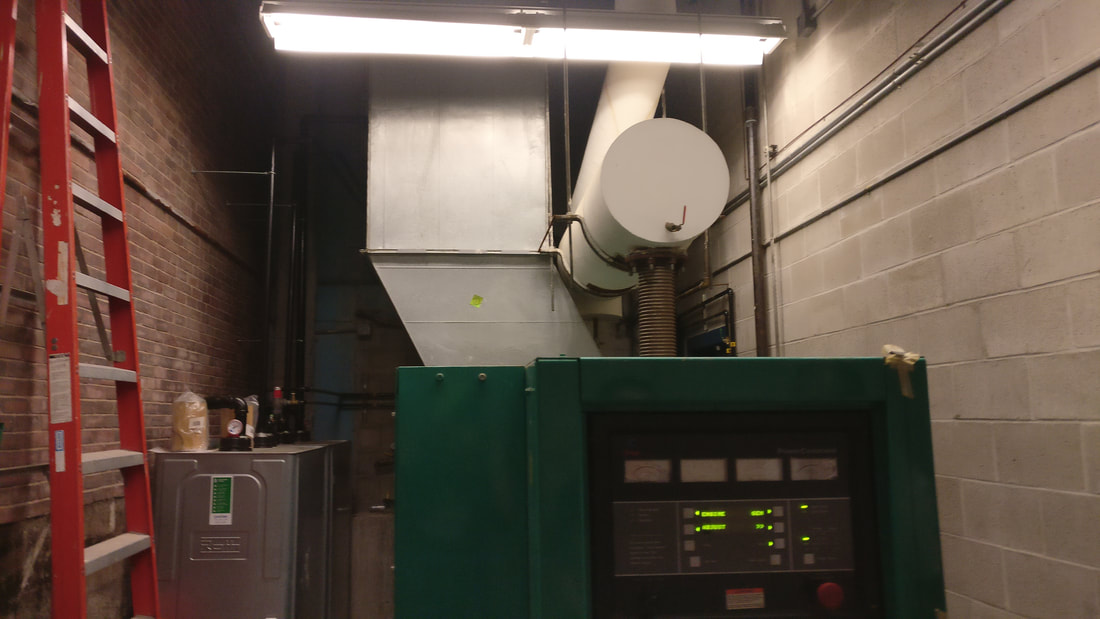
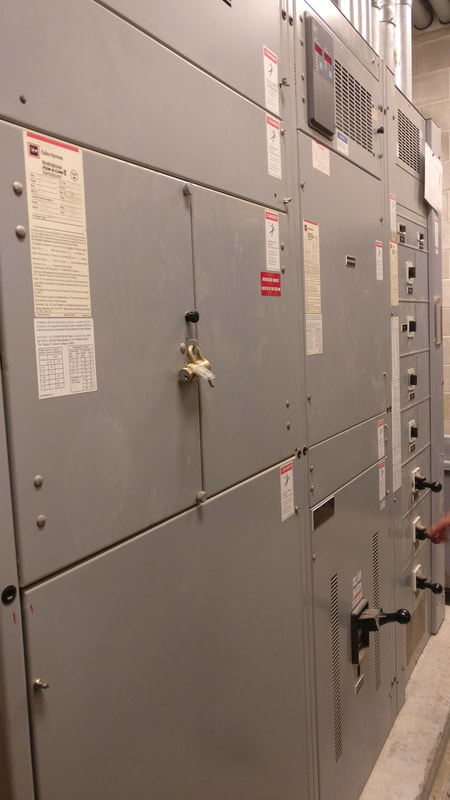
Once Mr. Navkal came in, he brought in a spare laptop for anyone to use. I ended up taking it and messing around for a little bit, upgrading its RAM to 8 GB (Ayush had a spare 8 GB stick and offered it to me, trading for my 4 GB stick) and then installing PyCharm on it. Installing PyCharm was a bit weird, because it was first downloaded as a tarball, then required some command line stuff to get PyCharm to run. After we got it running, Ayush told me that you had to run PyCharm from the terminal everytime, but we quickly figured out that there was an easy work around by going to "Tools" and "Create Desktop Entry". Like the past few days in this week, today was spent mostly working on the program, with exception to the end of the day. The problem I was having yesterday with the buttons not updating the search query was caused by a combination of not passing in arguments to a multiprocessing process and having a while loop within the process. Essentially, the program would run the process, but the process would not contain any variables unless they were specifically passed in, even if the variables were global variables within the program. Each process created by multiprocessing is almost like a completely separate program that runs a specific function that is passed into the process before it starts. I also created a new start_update function that would only be able to be called at the start of the program and if one minute had elapsed since the last time it had been called. This start_update function retrieves the data for the current selection (wing and floor number) and then updates the average value readouts on the GUI. I can't seem to get the values to update on the GUI, but I can retrieve the averages fine, which is really strange. I'll look into this more on Monday when I get a connection to the BACnet server again. After 1:00, we took a tour of the school's underground infrastructure (boilers, emergency generators, dirt room, etc.). This was probably the highlight of my day because it was really interesting to see the things that power the school and make it nicer to be in, all of which are hidden away and not intended to be seen. Soon after, we went underground and visited the boiler room. It was warmer than the outside in there, which makes sense. One curious fact Mr. Navkal mentioned was that newer boilers would only take up one half or less of the size of the current boilers, and the school would have to replace them soon, so there would be quite some space left in the boiler room. Next, we ventured into the emergency generator room where the emergency generator sits. Whenever the schools loses power, the emergency generator will turn on and power some of the stuff in the school. The generator can last for about a week with a full gas tank, but if it does not go through the proper checks monthly, it may not even turn on. Dan had an idea that we could create a program that could automatically send an email or notify the maintainer of the generator if the battery drains too far or has other problems. Very shortly after, we visited the main electrical room in AHS. The room was rather small, but it had the most power in the entire school (because P = IV and it was high voltage and high amperage). Finally, we visited the other parts of the back of the school, namely the dirt room and other things that happen behind the scenes to keep the school working. In conclusion, I found this trip around the unseen parts of Andover High School to be very interesting. There is a lot to learn and a lot to appreciate from the things that work to keep the school somewhat comfortable and running.
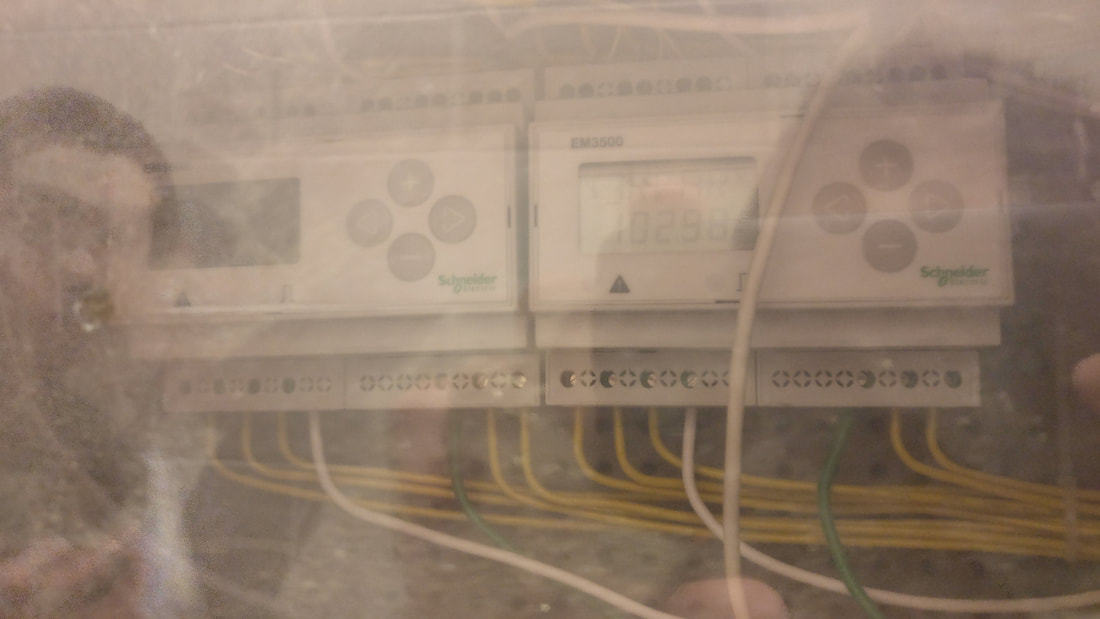
Mr. Navkal began today by talking about the Schneider Electric Building Analytics program. The program is extremely powerful and can display a lot of interesting information. The point that he was getting to, however, is that people are spending money on these kinds of applications for their buildings, but sometimes they are just too complex to use consistently and easily. Due to the complexity of the Building Analytics program, people find it difficult to digest all this information and are sometimes turned away because it's not easy to understand. A lot of this comes down to the specific problem that you want your tool to focus on. The Schneider Electric Building Analytics program is a lot more capable in showing where specifically a problem exists and what that problem is. However, the interface becomes more complex and difficult to understand in the process. The Energize Andover AHS tool can better tell how much energy is being used in a given amount of time in which general areas, but can not pinpoint or tell you what exactly might be wrong. It is up to the person interpreting the data to ask the questions and fix the problems, which wouldn't be too difficult because the information is simpler and easier to understand. After talking about this, we continued work on our program. I managed to successfully retrieve data from the BACnet server and output the data to the console. This wasn't as difficult as I initially thought, as most of it was using the pre-existing API built for Energize Andover. However, I could not figure out how to get the wing to change whenever I click on one of the buttons to change either the wing or change the floor number. The button clicks would still trigger a function callback and print the action in the console, but for some reason it wouldn't be able to update the query. Starting update_data process Staring Tkinter application Updating Data Wing - D Floor - 3 Label Facility Temperature CO2 Wing Floor 49 335 ahs 3001848 3001836 D 3 50 337 ahs 3001822 3001810 D 3 51 339 ahs 3001796 3001784 D 3 52 341 ahs 3001770 3001758 D 3 53 343 ahs 3001744 3001732 D 3 54 345 ahs 3001718 3001706 D 3 55 347 ahs 3001692 3001680 D 3 56 349 ahs 3001666 3001654 D 3 57 351 ahs 3001489 3001477 D 3 Facility - ahs | Room - 335 Room 335 --> Temp - 82.80523681640625, CO2 Lvl - 646.7744140625 Facility - ahs | Room - 337 Room 337 --> Temp - 86.8272705078125, CO2 Lvl - 725.125244140625 Facility - ahs | Room - 339 Room 339 --> Temp - 84.336181640625, CO2 Lvl - 571.852783203125 Facility - ahs | Room - 341 Room 341 --> Temp - 83.66152954101562, CO2 Lvl - 656.802734375 Facility - ahs | Room - 343 Room 343 --> Temp - 82.31219482421875, CO2 Lvl - 447.43603515625 Facility - ahs | Room - 345 Room 345 --> Temp - 82.41598510742188, CO2 Lvl - 1130.66015625 Facility - ahs | Room - 347 Room 347 --> Temp - 81.42996215820312, CO2 Lvl - 569.13525390625 Facility - ahs | Room - 349 Room 349 --> Temp - 82.6495361328125, CO2 Lvl - 603.037841796875 Facility - ahs | Room - 351 Room 351 --> Temp - 81.89703369140625, CO2 Lvl - 564.34765625 Label 83.148326 Facility 83.148326 Temperature 83.148326 CO2 83.148326 Wing 83.148326 Floor 83.148326 dtype: float64 Label 657.241347 Facility 657.241347 Temperature 657.241347 CO2 657.241347 Wing 657.241347 Floor 657.241347 dtype: float64 Console Output 9.1 - Output of the successful BACnet server query
After my break from Energize Andover, I'm ready to continue this interesting work. Mr. Navkal started by telling another one of his activist stories, where a company was attempting to set up cell towers in various towns. He linked it to using Geosheets, which allows you to create a Other than that, today (for me) was continuing work on the list GUI. I talked with Dan, who got most of it working, and figured out that my GUI was off and wouldn't work well. I also decided to give up on coding with Tkinter because it was becoming frustrating to create a decent looking user interface. However, I did find another library, called Pygubu, which allows you to build a GUI for Tkinter through a separate program that is much easier to use. Pygubu exports the configuration as a .ui file, then you can import it into Python and use it. Using this approach, I was able to create a more appealing user interface that works significantly better than solely coding in Tkinter. 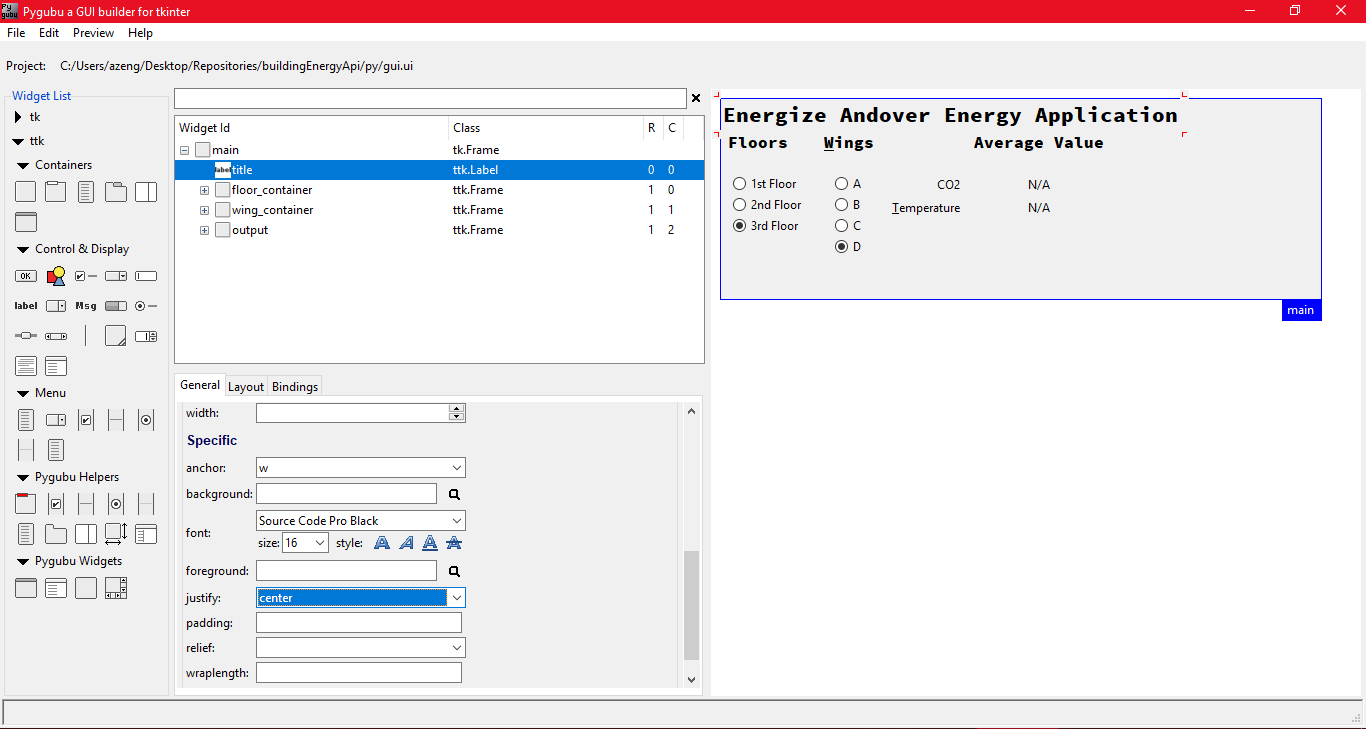 Picture 7.1 - Pygubu interface Most of my work today was spent figuring out how to use the Pygubu library, especially moving elements around and making it organized. Importing the .ui into my program was easy, and it worked as expected.
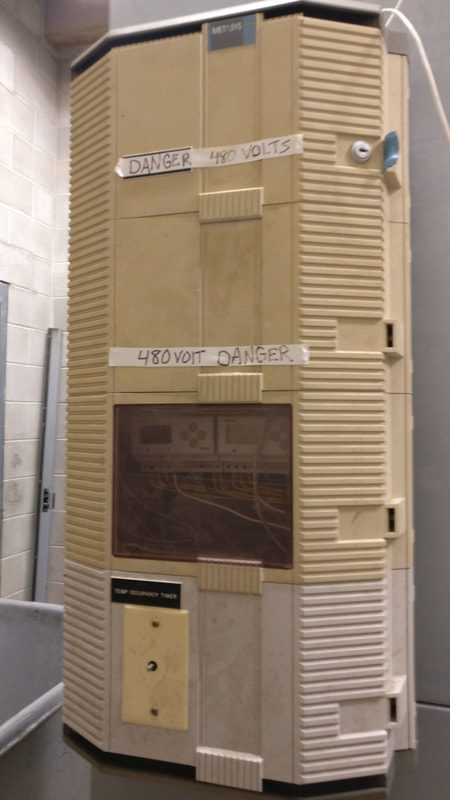
Near 1:00, we all lost access to the API where we get our sensor data. Ayush told us that his program was making three pings to the BACnet server per while loop, which is much more than necessary. The funny thing is that we could still access the Metasys server, but Ayush couldn't access anything, which led us to hypothesize that he had managed to get himself blacklisted from the server. Nevertheless, today was pretty interesting. I completely forgot that today's meeting started at 9:00, so I got here at 10:00. I didn't miss too much other than possible time to work on yesterday's assignment. We started by going over some electrical stuff, particularly talking about the electricity diagram for Andover High School. Before seeing the transformer inside this building, we talked about three-phase voltage and then wattage conversions. Transformers also make good heaters, as they often convert high voltage (480 V) to lower voltages (120 V) by taking in a lot of wattage (1000 kW). If the transformer is 98% efficient, then there are still 2 kilowatts that are turned into heat, which is actually just about the amount that a space heater uses. Mr. Navkal also brought a toaster into the room to show how much wattage they take (Spoiler: toasters use a LOT of wattage for their size). 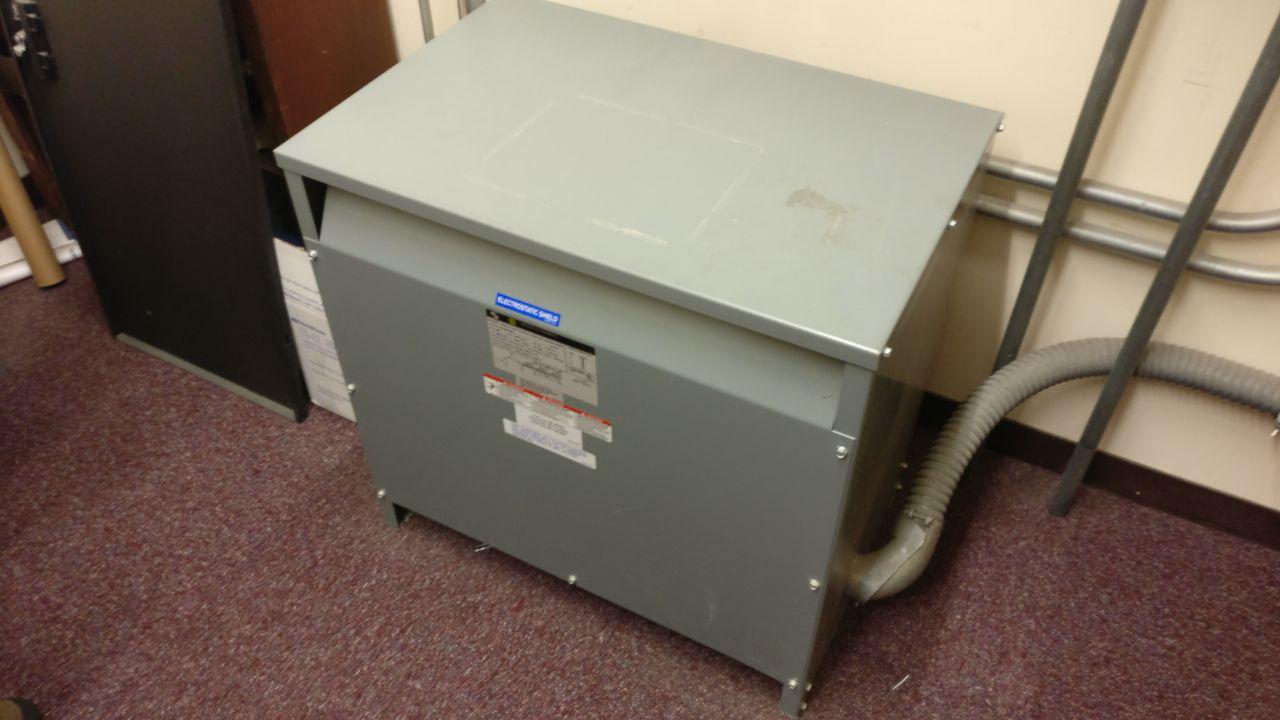 After these two hands-on experiences, we went into Panel Spy and saw that Andover High School has 26 transformers, all doing different voltage conversions. One of the largest reasons for this program is because the room numbers in AHS were manually changed about 20 years ago. All the transformers throughout the school still have the old room numbers, meaning that it is near impossible to have some place that links one room number on the transformer to the new room number in AHS. Without the work of Energize Andover, one would have to go to each transformer and find how it provides electricity to the school, but not it's significantly easier with this software. For the beginning part of today, we talked about what each one of us hoped to get out of this program. I really find it cool that we get to use the coding skills we learned in computer science classes and actually apply it to real world applications, potentially seeing our work help the lives of others or help the town. After that, we watched a TED Talk about ignorance and how not to be ignorant about the world, given by Hans Rosling and his son Ola Rosling. The talk was really interesting, as we humans tend to be ignorant because of personal biases (the places where we grew up, limiting our perspective because they are small), outdated data and world views taught by teachers, and news biases. Surprisingly, one of the largest things that make us human, our intuition, guesses based upon these factors and most of the time comes to negative conclusions that the world is becoming worse, when in actuality the world is progressing and becoming better. In order to not be ignorant, we need to go against our intuition and guess that things will naturally get better with time. 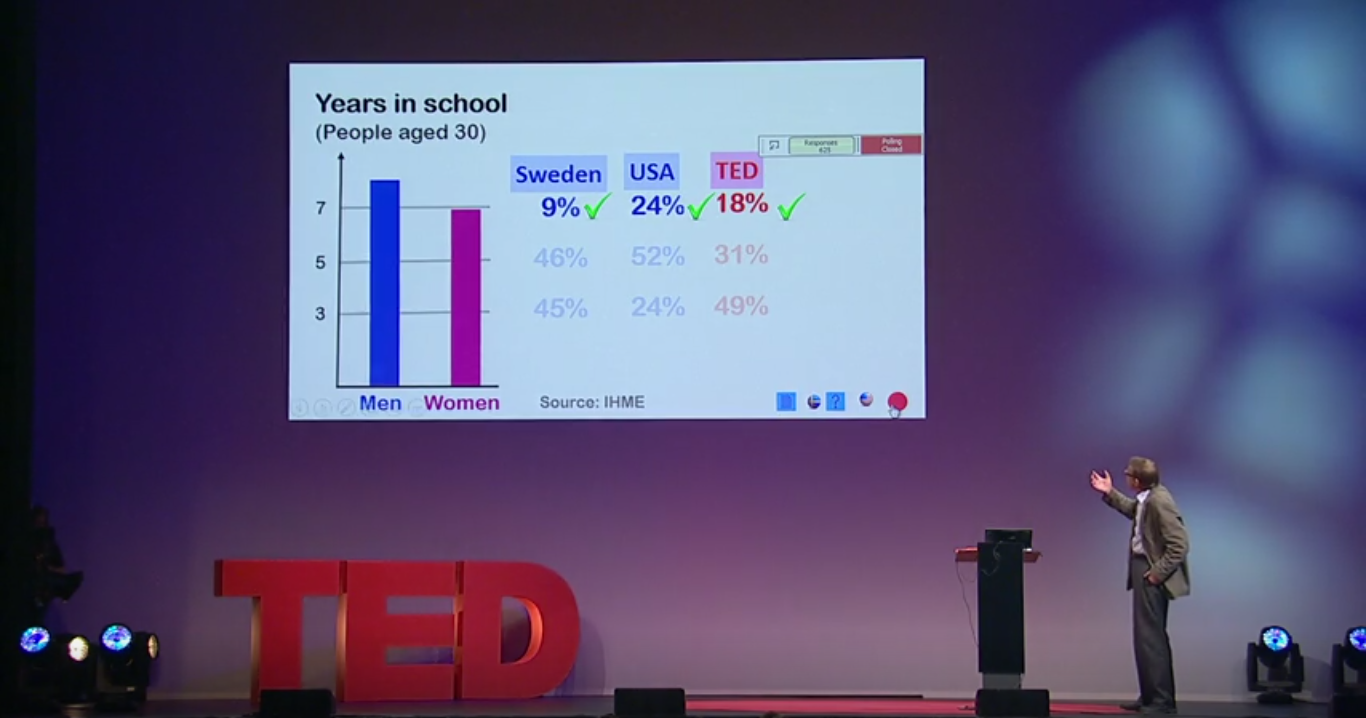 Picture 4.1 - A snippet of Hans and Ola Rosling's TED Talk Shortly after a break, we began talking about designs for an interactive dashboard that would be able to display the energy, temperature, and CO2 data. One of our main concerns for the dashboard is that it may not be the most interesting for people everyday. If it was explicitly for showing this data, people might think it's cool the first time and explore it, but they might not ever use it again. In order to keep people coming back, there needs to be some other things that interest them. Here are a few ideas we talked about:
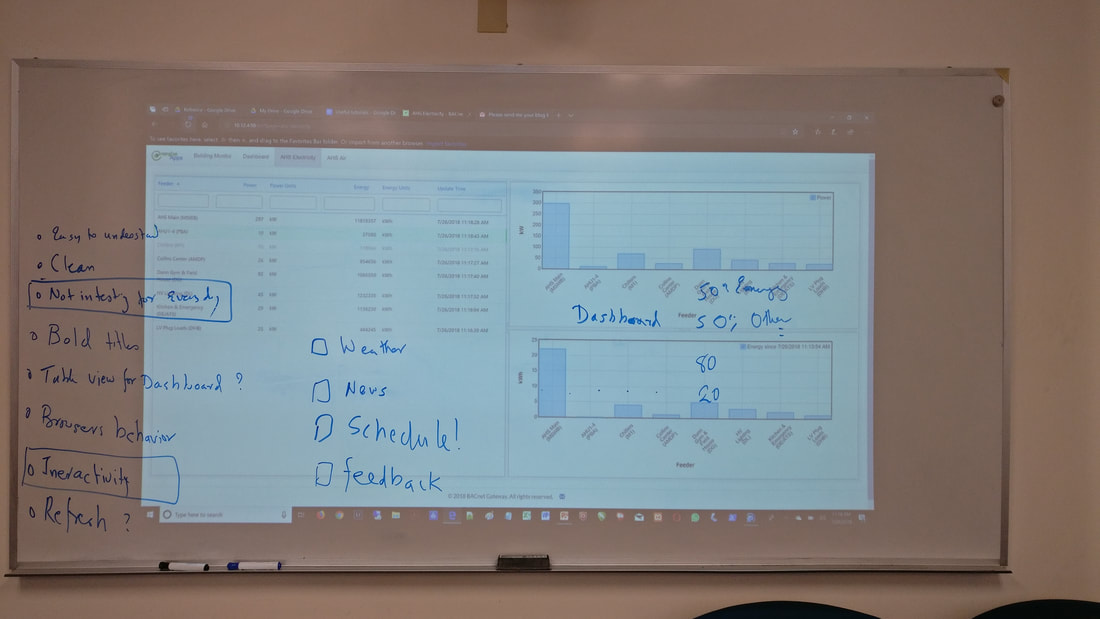 Picture 4.1 - A brainstorm of dashboard features. The current dashboard only shows the data of the school. Today we got another assignment where we are to use the buildingEnergyApi to hopefully make a GUI that lists the data of the wings of Andover High School on the second floor. So here goes a lot more reading documentation and finding packages that work...
1:20 - Found a few packages that might work. For creating a simple GUI, I could just use Tkinter, which I have tried a little bit. Two more interesting packages are Plotly and Dash (by Plotly). Plotly allows you to create many types of graphs in Python while Dash allows the creation of "beautiful web-based interfaces in Python" (quoted from their website). The best thing about Dash is that is built form Flask, which many of us have experience with. Intense Programming and Net Metering Right from the beginning of the day we began talking about code and coding. We started off by discussing the differences between waste and unusable material, as waste can still be reworked or minimized. After that, we dove straight into coding. Our first exercise was to rework the program we made yesterday and modify it so that the average CO2 was only taken from Monday to Friday. The CO2 levels can be higher on the weekends since there are far fewer people in the building. It took a while for me to get a working program, and I spent most of the time reading documentation and finding something that would get the program to work. A huge problem I encountered was how to reference the dates column within the dataframe. I could not figure out a way to access it initially, so I ended up using a different approach: filtering out the dataframes with a weekday mentioned in their dates column, then concatenating all the dataframes back as one, and finally averaging the mean. This isn't the nicest looking of ways to do it, but it worked. 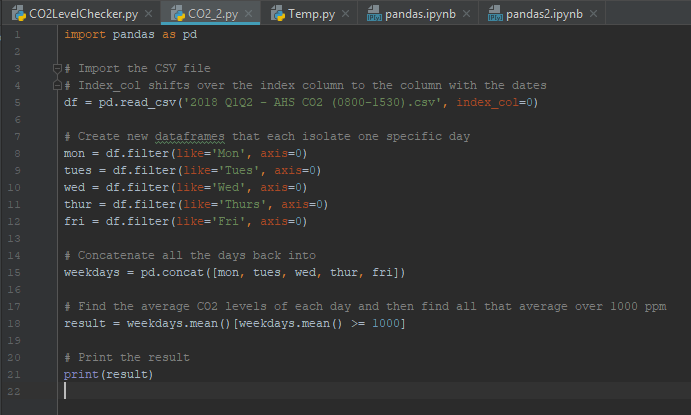 The second exercise was similar, although we had to use a different input CSV file with temperatures around the school and find which classrooms, on average, were warmer than 75 degrees Fahrenheit. My original method would not work with this data set because it relied on having the day being present in the dates column, and the dates in this data set did not have dates. I was stuck. Luckily, I was able to look at Samar's code and figured out a far more effective and efficient method of isolating the data. He found a pandas function called pd.to_datetime() that converted some time input into datetime, which could then allow him to find the day of the week and time much more easily. 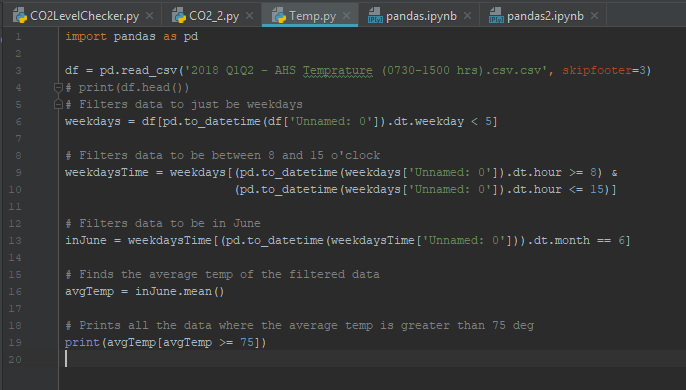 After eating lunch downstairs, Janet Nicosia came into our room and talked about Andover's electricity usage, particularly about how the high school runs 100% on solar. Essentially, Andover entered in on a deal with a local solar farm on a landfill in Palmer, Massachusetts where they would buy electricity from the solar farm (according to the cost per kWh of the solar farm) to power municipal buildings and various schools in Andover. These buildings take about 90% of the energy generated from the solar farm, and Andover gets the large majority of the electricity generated from this farm.
The best part of this deal is something called net metering, which allows any excess energy produced by the solar farm to be converted into credits for National Grid. During the summer months, where the solar panels generate more electricity than the town uses, credits are stockpiled and can be used instead of paying money during the winter months, where solar generation might be significantly lower. So far, this deal has been so good that Andover has a net gain of credits, allowing us to save a lot of money and use it for other purposes. The deal lasts for 20 years, so there's more than a decade left of money savings. I really like this deal and Andover's efforts in supporting clean energy. Even though we may not be paying for the exact energy provided by the solar farm because National Grid manages energy distribution, we are still supporting that solar company. This is the first day of the summer camp / internship (I really don't know how to describe the experience), and it was mostly introduction to the program and reasons for the program's existence. Although I didn't find it to be the most interesting, I definitely think it's necessary to have the background information before embarking on this exploration. With that being said, there were still some things that were pretty interesting. I didn't realize how much energy is being lost everywhere. We waste so much energy, sometimes just because the processes are so inefficient. For example, a car engine typically has an efficiency of about 25%, meaning that only a fourth of the input energy is used to propel the car. For an electric car, nearly all of the input electricity is used to power the motor. Using petroleum and natural gas for electrical energy is also really inefficient. To produce the same amount of energy, fossil fuels waste a ton of energy that becomes heat, which also makes them more expensive per kWh. This is the main reason why this program exists: to help the town of Andover minimize its energy usage and conserve energy, especially when we don't need to be using it. 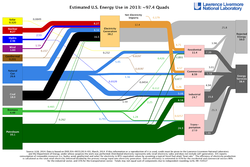 We also talked about CO2 emissions and the air conditioning systems within the town's schools. If the amount of CO2 emissions exceed 2000 ppm, then it becomes dangerous, with 4000 ppm becoming extremely dangerous. 1000 ppm and less is the sweet spot for having the air be comfortable. Another aspect of this program is to monitor the HVAC systems of the town, so we learned about how those systems work. Lastly, we ended today with coding. We modified an API to output a CSV file that could be read by a plotting program on the data providing web service. It wasn't all too difficult, but some of the headers in the CSV file had to be named exactly '"Date / Time"', '"Name Path Reference"', '"Object Name"', '"Object Value"' respectively. I think this was the highlight of the day, as I was hoping to do a lot of programming at this camp / internship. BACnet and More Coding We began today discussing the infrastructure that provides us, the students, with data that we can use to create applications and other things that might help the town. Mr. Navkal told us how we are all extremely lucky to have a town that is willing to allow us to see data about the town's buildings, as many towns don't even give this a thought. In allowing us to access the data, the web service platform limits requests to about one per second, so one student doesn't accidentally try to access the temperature 1000 times per second (which is not logical in the first place because temperature barely changes every minute). I think this is a pretty good compromise to allow us to see the town building data. The coding we did today was to create a program to take in an input set of data (we used the CO2 levels in the first half of 2018 for AHS during 8:00 AM to 3:30 PM) and output a report of all the classrooms that averaged over 1000 ppm of CO2. I initially used a for loop and iterating through the result of file.mean(), but the output of file.mean() only output one column of data, so it was not possible to access the room name alongside the CO2 level. After some research and talk with my friends, we all figured out that you could condense the code all into 3 working lines of code, as seen below: 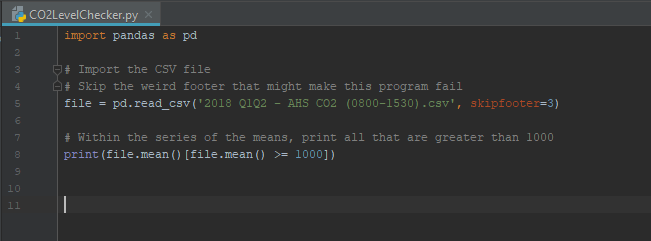 Picture 2.1 - Snippet of my final code for today. Note how condensed pandas can make the code. I am honestly really surprised by how powerful the pandas library is. Normally, if you had an array instead of a CSV, this would take so many more lines of code than written above. pandas allows you to stick everything so condensed and makes it quite a bit easier to look at.
|
Author
Write something about yourself. No need to be fancy, just an overview. ArchivesCategories |


 RSS Feed
